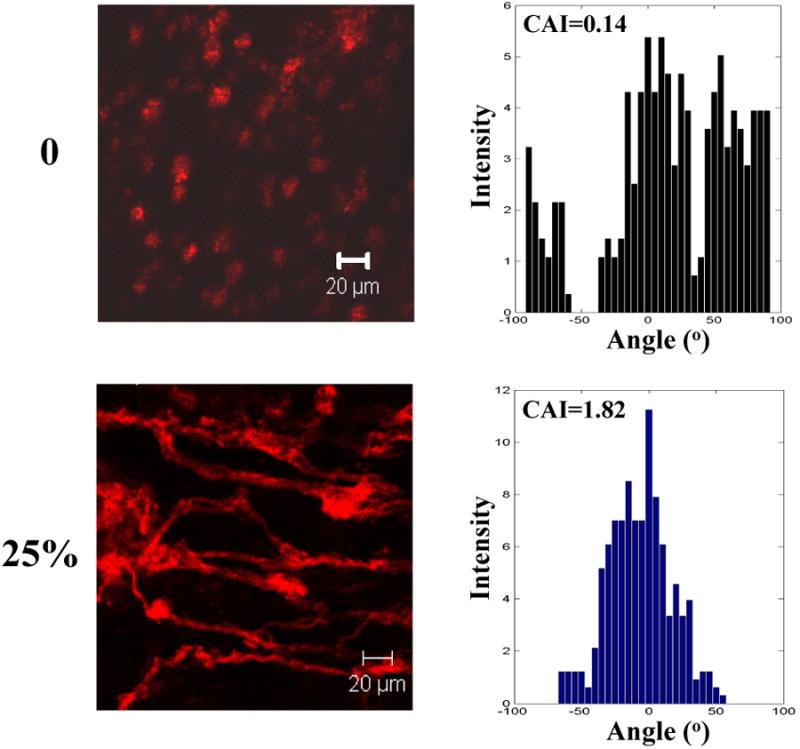
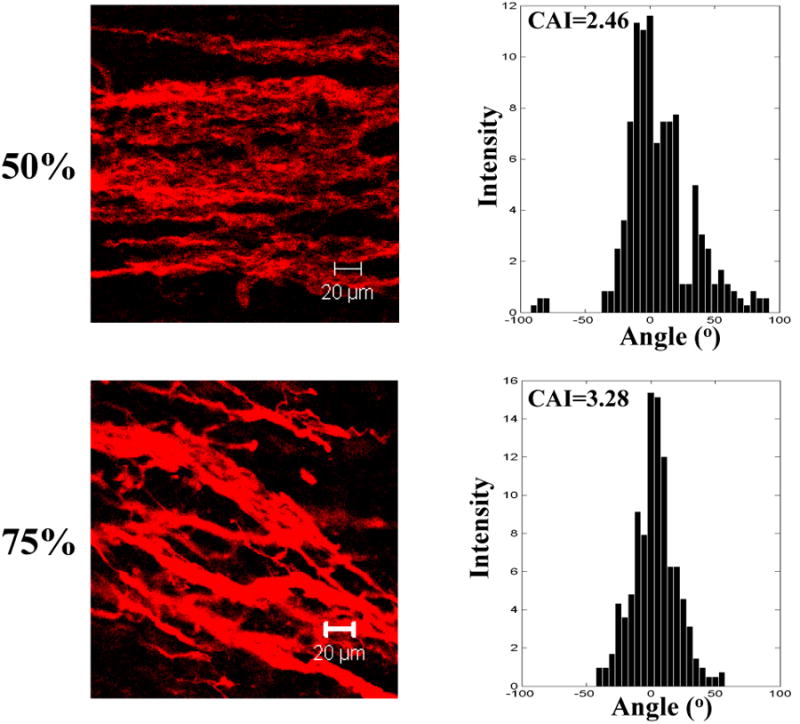
Figure 8.


Representative Z-stack confocal images and cell anisotropic index (CAI) of MSCs in the tissue constructs stretched at different strains (0, 25, 50 and 75%) on day 7. F-actins of the cells were stained with rhodamine phalloidin. All images were taken at a depth of 45 μm.
