Figure 1.

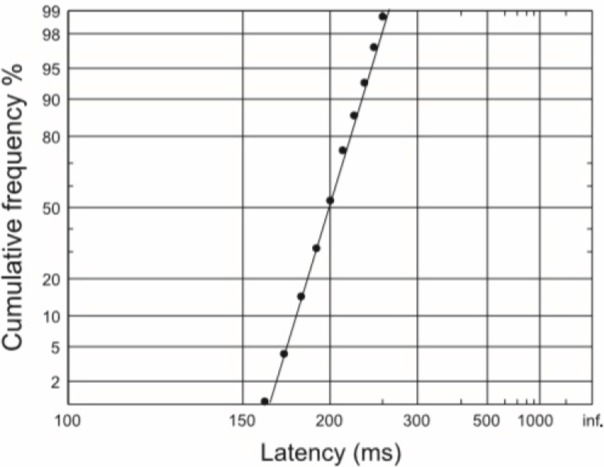
A reciprobit plot of typical saccadic latencies, in which a straight line is obtained if reciprocal latencies are plotted on a cumulative y-axis scale.

A reciprobit plot of typical saccadic latencies, in which a straight line is obtained if reciprocal latencies are plotted on a cumulative y-axis scale.