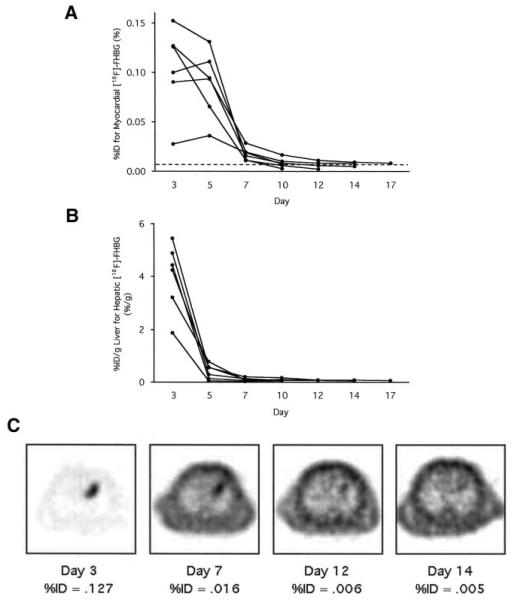
Figure 7.
A, Time course of %ID for myocardial [18F]-FHBG accumulation calculated from microPET images serially scanned with 6 rats. Broken line indicates cutoff %ID value for visually identifiable [18F]-FHBG accumulation. B, Time course of %ID/g liver for hepatic [18F]-FHBG accumulation calculated from microPET images in the same 6 rats. C, Transaxial [18F]-FHBG microPET images at similar slice levels of a representative rat scanned serially. Gray scale is normalized to the individual peak activity of each image. In this rat, we judged that localized myocardial [18F]-FHBG accumulation was visualized up to day 12 and no longer on day 14.

