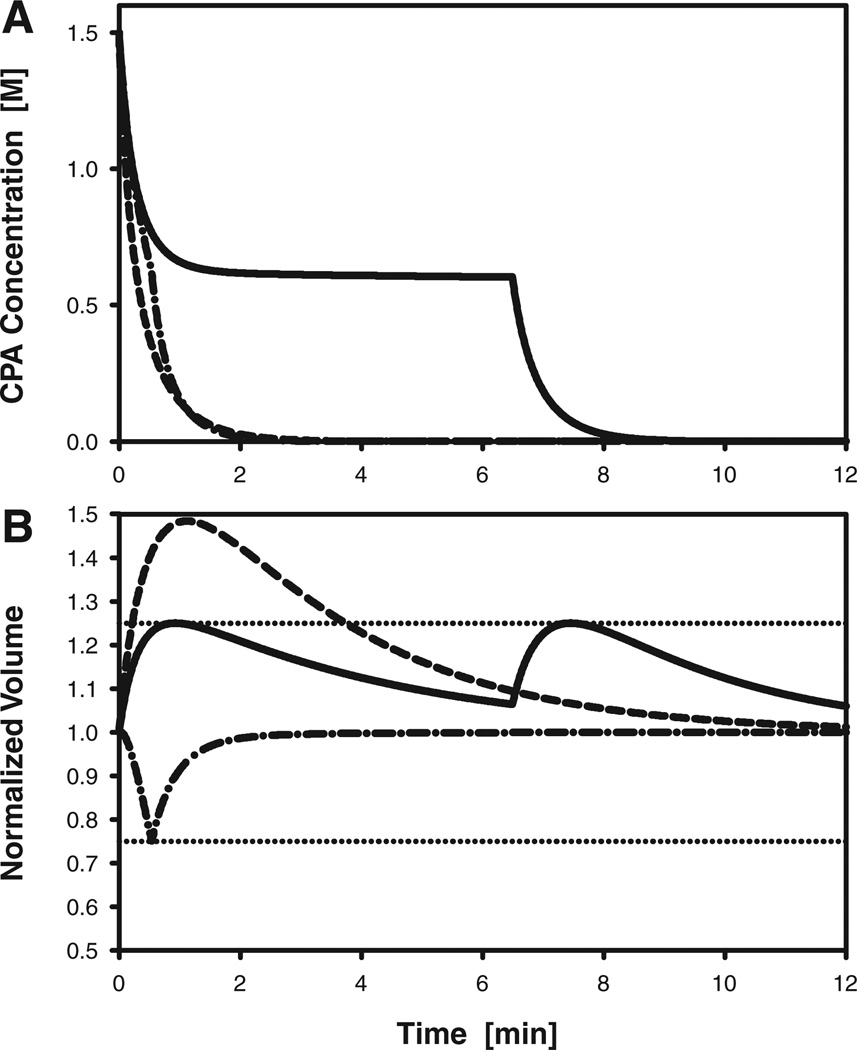
Figure 6.
Predicted response of rhesus monkey oocytes during dilution of PROH, which is initially present at an intracellular concentration of 1.5 M. A: Intracellular concentration of PROH. B: Oocyte volume, normalized to the isotonic cell volume; the horizontal dotted lines indicate the upper and lower bounds of the assumed range of tolerable volume excursions (75–125% of the isotonic volume). Dashed curves represent the response to a nonoptimized single-step dilution process, in which oocytes are transferred directly to isotonic medium. Solid curves represent the response to an optimized two-step dilution process, in which oocytes are first exposed to a solution containing 0.6 M PROH for 6.5 min before transfer to isotonic medium. Dash-dotted curves represent the response to an optimized two-step dilution method that uses sucrose as an osmotic buffer: oocytes are first exposed to a solution containing 1Msucrose for 32 sec before transfer to isotonic medium.

