
Figure 2. Hepatic PPARδ controls liver lipogenic gene expression and muscle FA uptake.
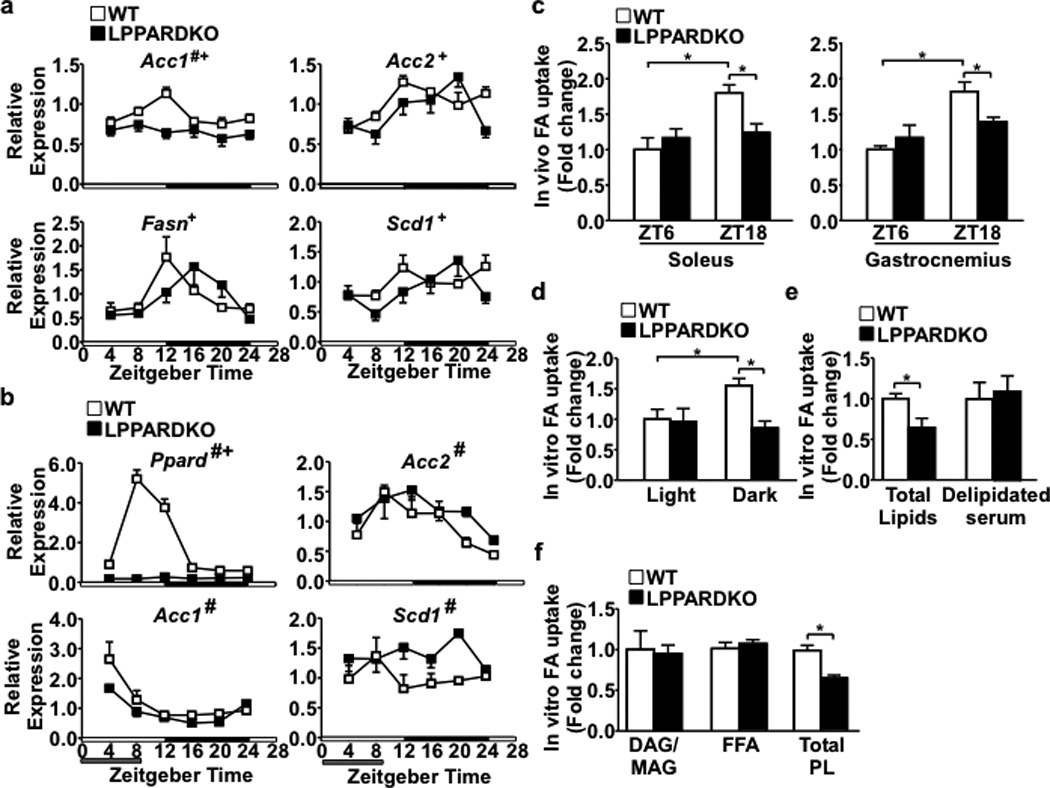
a. Hepatic lipogenic gene expression in wt and LPPARDKO mice (n=4/time point). White and black bars on the x-axis represent light and dark cycles, respectively. b. Liver gene expression under daytime feeding (n=3). #p<0.05 (ANOVA), wt vs. LPPARDKO; +p<0.05, comparing circadian patterns. c. In vivo muscle fatty acid uptake (n=3). d.-f. In vitro fatty acid uptake in C2C12 myotubes treated with serum (2%) pooled from light or dark cycle samples, serum total lipids or delipidated serum (dark cycle samples) or serum lipid fractions (n=3). *p<0.05 (t-test), data shown as mean±SEM.