
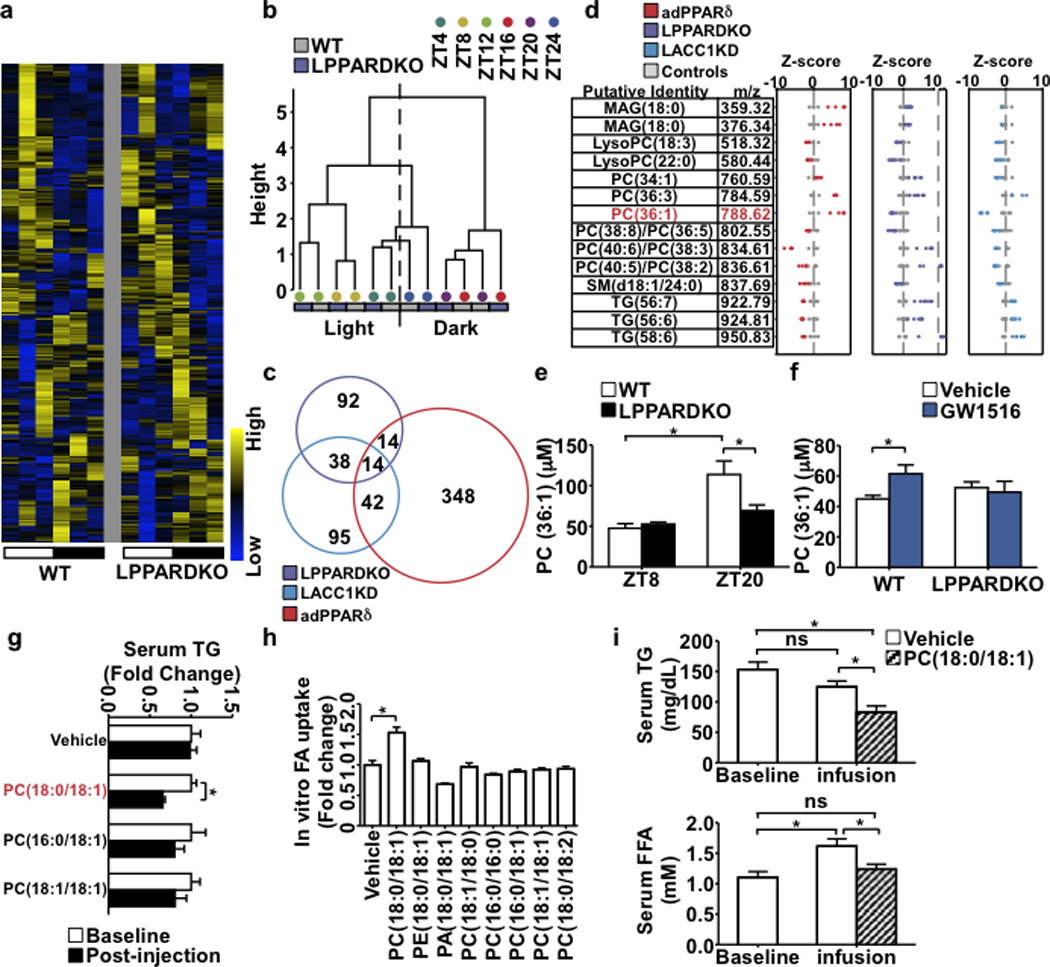
Figure 3. PC(18:0/18:1) links hepatic PPARδ to serum lipid levels and muscle FA uptake.
a. Serum lipid heatmap (n=3/time point). White = light (starting at ZT4) and black = dark cycles. b. Dendrogram from hierarchical clustering. c. Cross-comparison of changed lipids. d. Z-score plots of 14 commonly changed features. e. Serum PC(36:1) quantification in wt (n=5) and LPPARDKO (n=4) mice. f. Serum PC(36:1) concentrations in wt/LPPARDKO ± GW501516 (n=5). g. Serum TG changes (tail vein injection) with PLs in wt mice (n=6). h. FA uptake in C2C12 myotubes treated with PLs (50 µM, n=3). i. Serum TG and FFA levels after PC(18:0/18:1) infusion (n=6, wt C57BL/6J mice). *p<0.05 (t-test), data presented as mean±SEM.