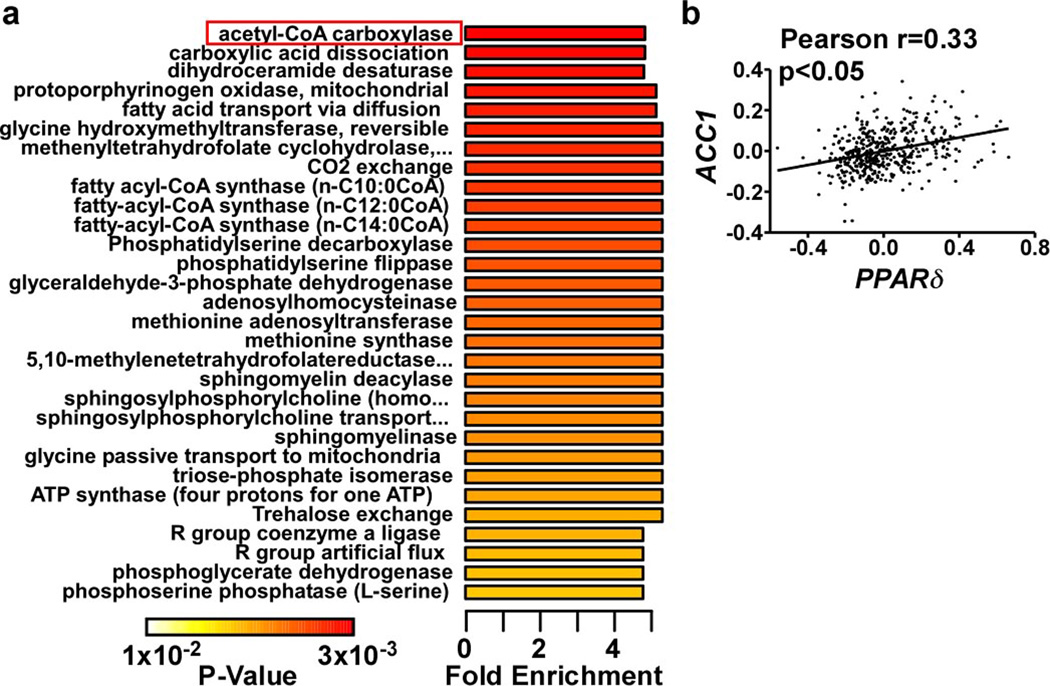
Extended Data Figure 1. Analyses of liver lipid metabolites altered by PPARδ over-expression.
a. Metabolite set enrichment analysis (MSEA) of lipids from adGFP and adPPARδ liver lysates (n=4). Metabolites were identified based on database search of matching mass-charge ratio and retention time. Identified metabolites and their relative quantity were used to calculate the enrichment and statistical significance. Top 30 perturbed enzyme or pathways were shown. List of metabolites recognized by the Metaboanalyst program and subsequently used for the MSEA analysis is shown in Supplementary Table 1. b. Correlation of hepatic PPARD and ACC1 expression in human liver. Human liver gene expression microarray data was downloaded from gene expression omnibus (GSE9588) and analyzed using Graphpad Prism. *p<0.05 (t-test).

