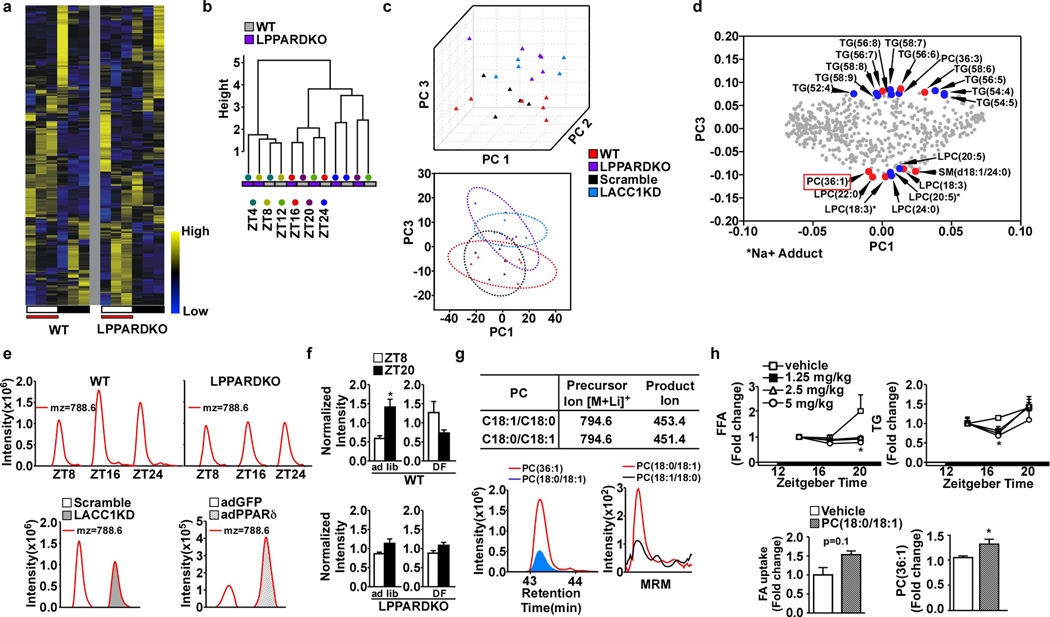
Extended Data Figure 3. Identification and characterization of PC(18:0/18:1), or SOPC.
a. Heat map of identified features in wt and LPPARDKO serum under daytime feeding (n=3, each time point). White bar: light cycle starting at ZT0; Black bar: dark cycle; Red bar: time when food was available. b. Dendrogram of serum samples under daytime restricted feeding. c. Principal component analysis (PCA) of positive mode features in wt, LPPARDKO, Scramble and LACC1KD serum under ad lib feeding. Top: score plot of the first three PCs representing 53.2% of the total variation. Bottom: score plot of PC1 and PC3. Circle: 95% confidence interval. d. Loading plot of the PCA. The putative identities of 11 features identified in Fig. 3d are shown in red. Additional top features contributing to the segregation are highlighted in blue. e. Top panels: EIC of mz=788.6 in wt and LPPARDKO serum. Bottom panels: EIC of mz=788.6 in LACC1KD serum and adPPARδ livers. f. Normalized PC(36:1) intensity in wt and LPPARDKO mouse serum (n=4) under ad libitum or daytime restricted feeding (DF). g. Top: Multiple reaction monitoring (MRM) parameters for identification of acyl-chain composition of PC(36:1). Bottom left: Co-elution of the PC (18:0/18:1) standard with mz=788.6. Bottom right: PC(36:1) acyl-chain composition determined by tandem mass spectrometry running in the MRM mode. h. Top panels: Lipid levels in mice i.p. injected with various doses of PC(18:0/18:1) (n=4). Bottom: In vivo FA uptake in soleus muscle (left) and serum PC(36:1) enrichment (right) 4 hours after PC(18:0/18:1) injection at 5mg/kg body weight. *p<0.05 (t-test), data presented as mean±SEM.

