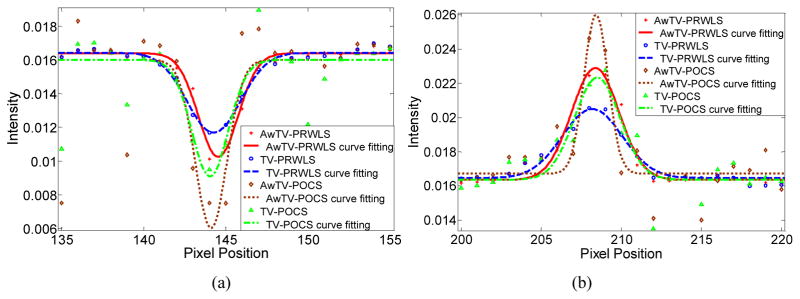
Figure 13.

Horizontal profiles of the CatPhan® 600 phantom images reconstructed by different algorithms from 79-view 10mA projection data. Picture (a) shows the profiles across the cold spot (146th row, 135th to 155th column). Picture (b) shows the profiles across the hot spot (and 139th row, 200th to 220th column).
