
Fig. 2.
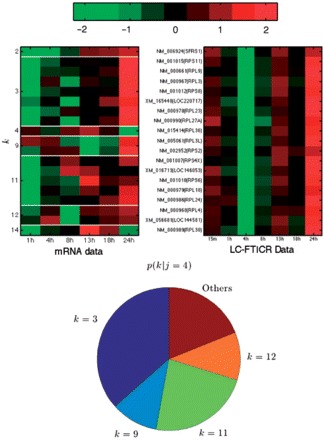
Protein cluster j=4 containing ribosomal proteins. Right-hand heat map shows protein profiles in j=4. Left-hand heat map shows associated mRNA profiles (each row corresponds to the same gene in each side) ordered by the mRNA cluster in which they are placed (i.e. top gene is in k=2, next group are in k=3, etc.). Red corresponds to high, green to low expression. The lower chart shows the probabilities p(k∣j=4) calculated from the conditional prior via Bayes law. Each colored segment corresponds to one mRNA segment and segment size is proportional to probability.