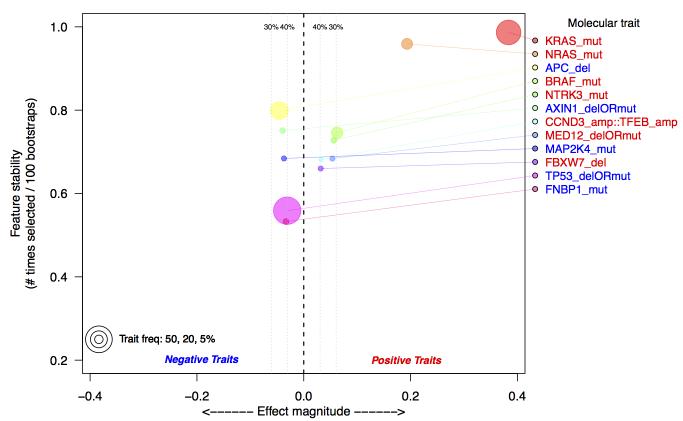
Figure 2.
Top selected molecular aberrations that explain RIS in TCGA colorectal data. Aberrations are defined as either somatic mutations (mut), homozygous deletion (del) or amplifications (amp). Aberrations are identified using a multivariate Lasso model, regressed against the estimated RIS. Along the y-axis is the frequency with which an aberration is selected from 100 bootstraps of the data; the x-axis is the effect magnitude, computed as the average beta value from the Lasso model over all bootstrapped models. Estimated false discovery thresholds are shown as vertical lines, and only aberrations below a 40% false discovery threshold are plotted. The selection of KRAS and NRAS as the top selected features serves as a positive control.

