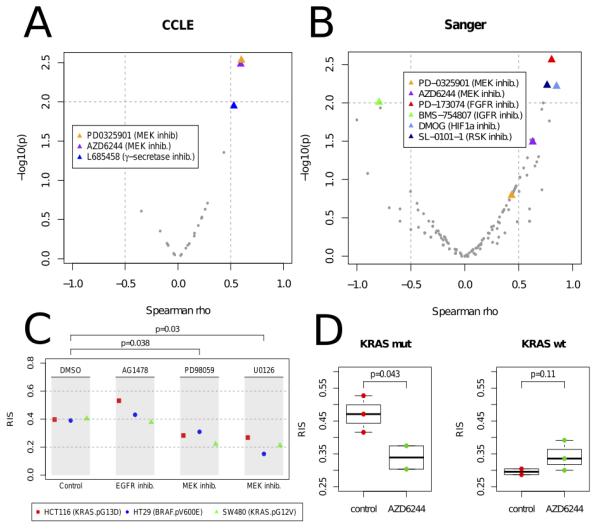
Figure 4.
Volcano plots of Spearman correlation (x-axis) and significance (y-axis) evaluated between drug sensitivity (AUC) and RAS index score (RIS) in the [A] Cancer Cell-Line Encyclopedia (CCLE, 24 cancer drugs) and [B] Sanger Cell Line drug panel (130 drugs). Significant drug associations (p < .01) are highlighted. [C] RIS measured in 3 CRC cell lines (HCT116, HT29 and SW480) following treatment with anti-EGFR drug AG1478, and MEK inhibitors PD098059 and U0126. Reduction of RIS is observed in the cell lines treated with MEK (p < .05). As a negative control, the EGFR treated cell lines exhibited no reduction of RIS. [D] Xenograft CRC model showing distribution of RIS pre- (red) and post (green) treatment with MEK inhibitor Selumitinib (AZD6244) (n=10). RIS reduction is observed in the KRAS mutant cell line (HCT116) treated with MEK inhibitor, whereas the KRAS wild-type treated cell line (HKH2) shows a modest increase in RIS.

