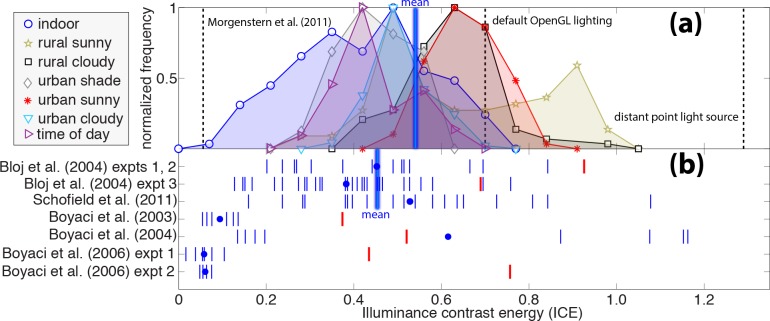
Figure 3.
Comparison of lighting diffuseness from natural lighting and psychophysical performance. (a) Histograms of the ICE of natural lighting in several environments, each scaled to peak at one. The “time of day” histogram shows the measurements made over the course of a single day. The dashed vertical lines show the ICE of a light source matched to Morgenstern et al.'s (2011) “weak cue” condition (the line labeled “Morgenstern et al., 2011”), default OpenGL lighting, and a distant point light source. The thick vertical blue line shows the mean ICE over all environments. (b) Psychophysical estimates of observers' assumptions about diffuseness. Small vertical blue lines show the ICE assumptions of individual observers. Blue dots show averages across observers. The thick vertical blue line shows the mean ICE over Bloj et al.'s (2004) and Schofield et al.'s (2011) experiments, which, as we explain in the main text, are the studies we think most relevant for a comparison with natural lighting. Red lines show the ICE of the actual illuminants in the experiments. Schofield et al. ran their experiments in the dark and with a highly ambiguous sine wave stimulus, so we do not show a red line indicating an ICE value for their lighting.

