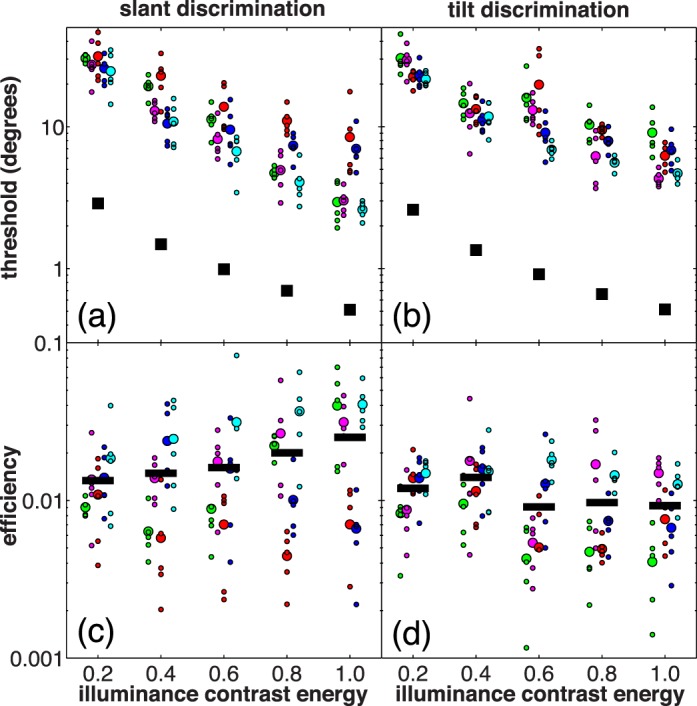
Figure 5.

Thresholds and efficiency in the lighting direction discrimination experiment. Each color corresponds to a different observer. Each small colored data point shows a threshold or efficiency from one 150-trial block, and each large colored data point represents the average threshold or efficiency for a single observer over five blocks. The black squares in the top two panels show the ideal observer's thresholds. The black lines in the bottom two panels show efficiency averaged over all observers at a single ICE level. All observers viewed lighting conditions with the same five ICE values, but we have jittered the data points horizontally so that they do not overlap. (a) Thresholds in the slant task. (b) Thresholds in the tilt task. (c) Efficiency in the slant task. (d) Efficiency in the tilt task.
