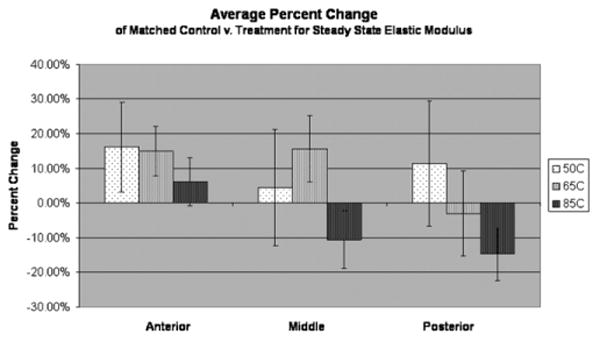
Fig. 7.

The percent change between each matched control and post-treatment value was calculated and averaged for each respective region and maximum temperature. Standard error bars are shown, which indicate high variability in percent change. At 85°C there is a slight trend of decreased elastic modulus at middle and posterior regions.
