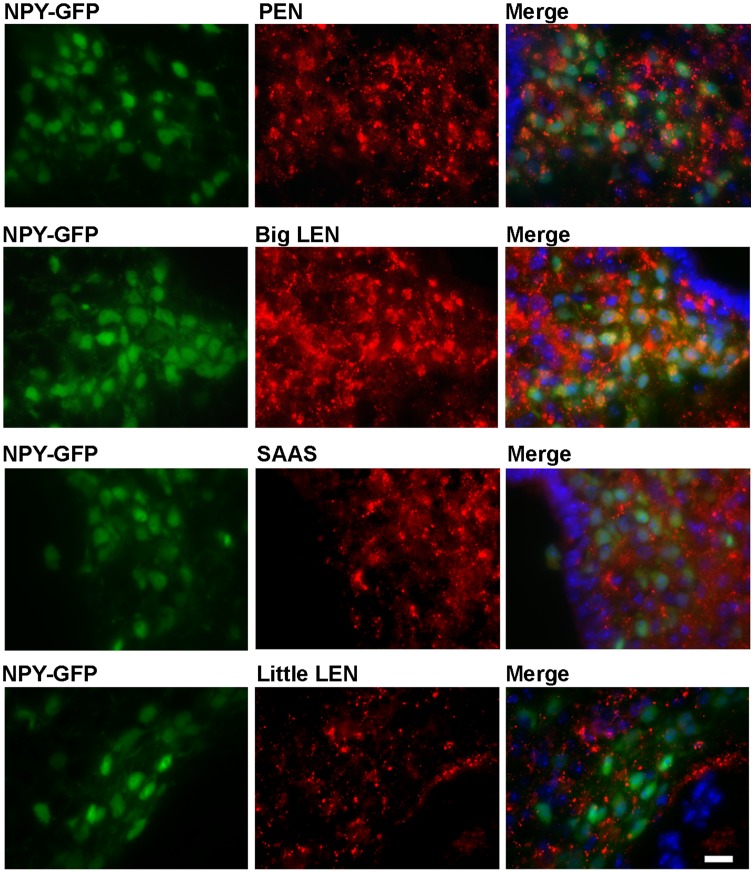
Figure 2. Comparison of the distribution of proSAAS-derived peptides and NPY-expressing cells in the arcuate nucleus of the hypothalamus.
Immunofluorescence was performed in mice expressing GFP under the NPY promoter, as described in Materials and Methods. Left panels show the distribution of GFP, which is localized to the cytosol and reveals the cell bodies of NPY-positive neurons. Middle panels show immunofluorescence of the indicated proSAAS-derived peptide. Right panels show the merged images from the left and right panels. Cell nuclei were visualized with DAPI (blue color, right panels). Scale bar = 10 µm.

