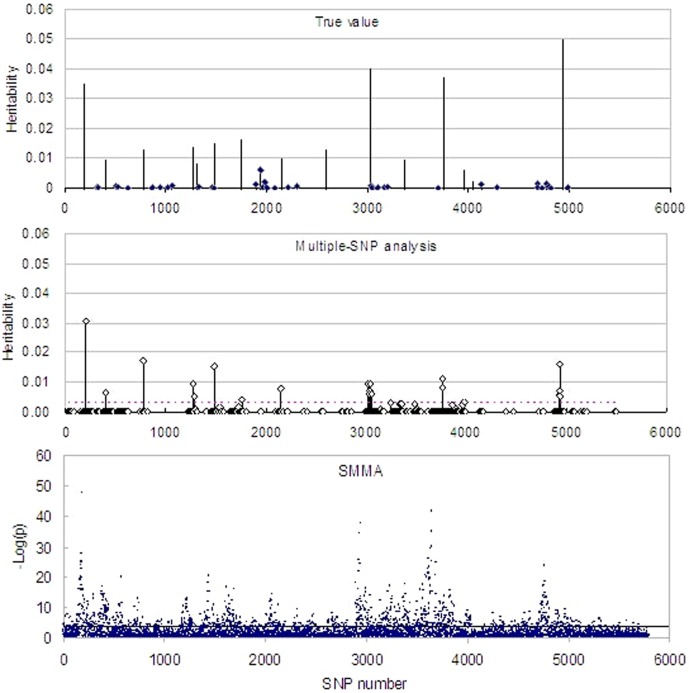
Figure 1. The profiles of the true SNP parameters (the top panel), the estimated 500 SNP heritabilities with MEML (the middle panel) and −log10 P with SMMA (the bottom panel), respectively.
The x-axis indicates the SNP numbers. In the top panel, the true heritabilities of small-effect SNPs are presented with diamonds on the top of their needles but not for large-effect SNPs. The dotted horizontal lines in the middle and the bottom panels present the thresholds with 1,000 permutations from the multiple-SNP and SMMA methods, respectively.

