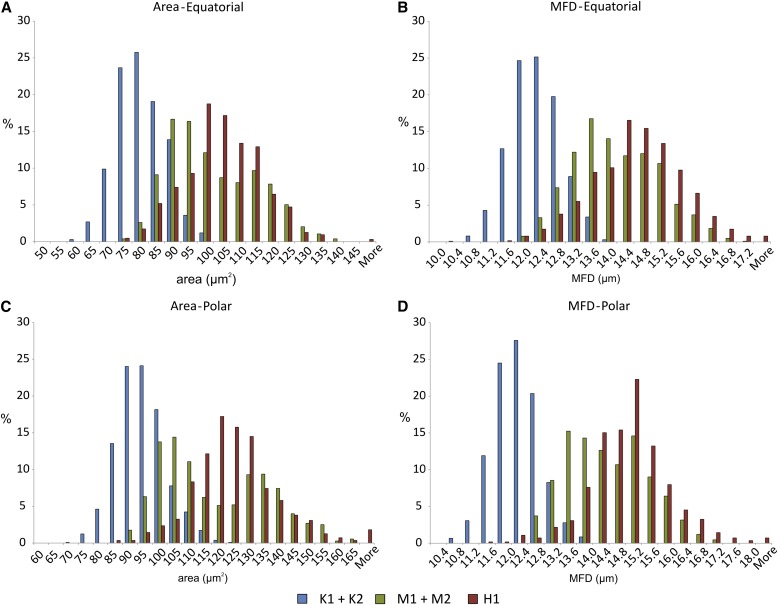
Fig. 4.
Relative frequency distribution data for area and maximum Feret diameter (MFD). Distributions for the two individuals of each taxa have been combined to produce a single distribution, and data for the honey sample have been added. (A) Area, equatorial view; (B) MFD, equatorial view; (C) area, polar view; (D) MFD, polar view.

