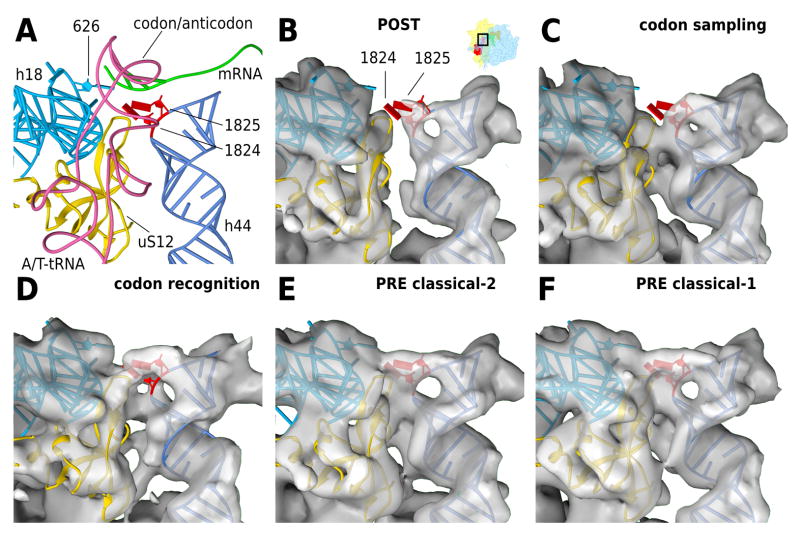
Figure 6. Codon recognition and 40S domain closure at the decoding center.
(A) Models for the codon recognition / GTPase activation state complex. The decoding center is shown from the 60S side, with h44 in light blue, h18 containing the 626 (530, E.colinumbering ) loop in dark blue, A/T-tRNA in pink, mRNA in green and uS12 in gold. Bases 1824 and 1825 (1492 and 1493, E.coli numbering) of h44 are highlighted in red and are shown in the flipped out positions modelled to the codon recognition state. Panels B–F show density maps for the (B) POST state, (C) the codon sampling state, (D) the codon recognition / GTPase activation state, (E) the PRE classical-2 and (F) the PRE classical-1 state. The models are kept fixed in the recognition state in all panels for better comparison. Electron density maps are aligned to h44 and 40S platform. For clarity, the density around h44 and uS12 has been segmented to show only the surface-most layer.
See also
Movie S3. 40S domain closure in the decoding center and shoulder domain.

