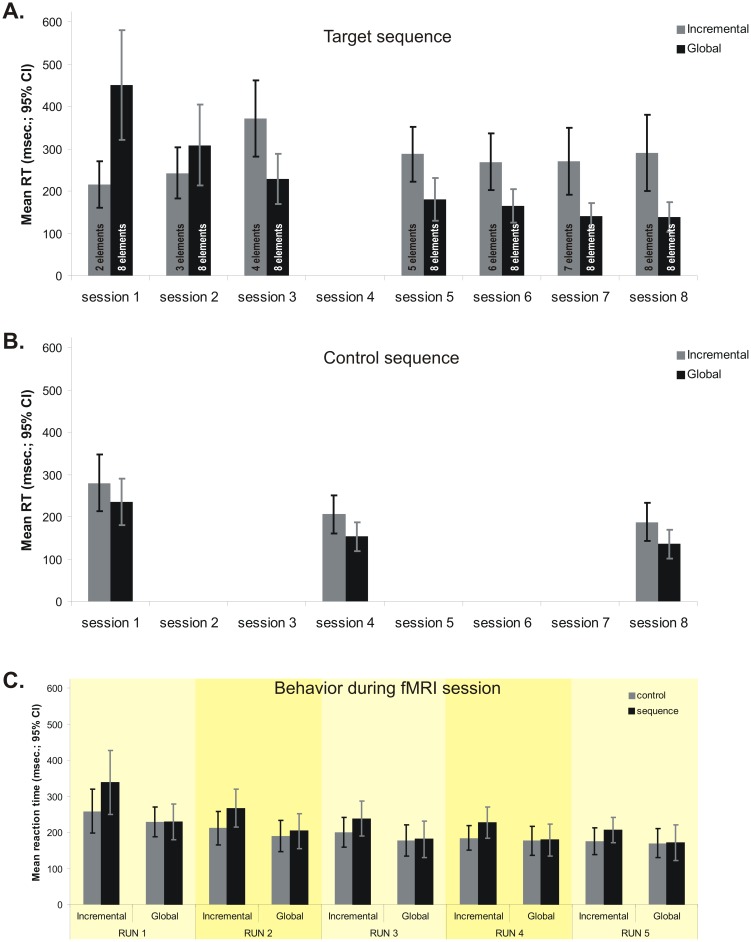
Figure 2. Behavioral results.
A. Mean reaction time for the target sequence in the training sessions, for each group. B. Mean reaction time for the control sequence in sessions 1, 4 and 8, for each group. C. Mean reaction time for target and control sequences and for each group during the fMRI (9th) session.

