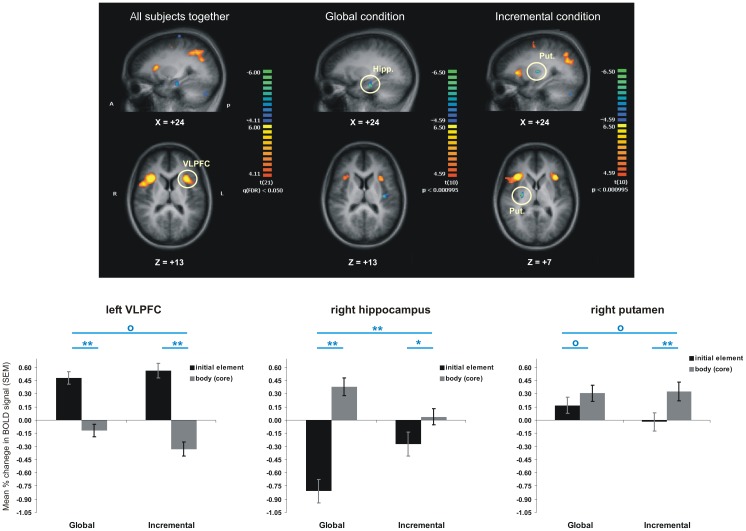
Figure 5. Areas more activated during initial than the subsequent elements of a sequential chunk (orange regions), as well as areas activated more during the core than initial chunk element (blue regions).
The bar graphs show the percentage change in blood oxygenation level dependent (BOLD) signal in selected regions, for each group and type of trials. Blue stars indicate significant statistical differences (p<0.05 for one star and p<0.001 for two stars), whereas blue circles indicate no significant difference.

