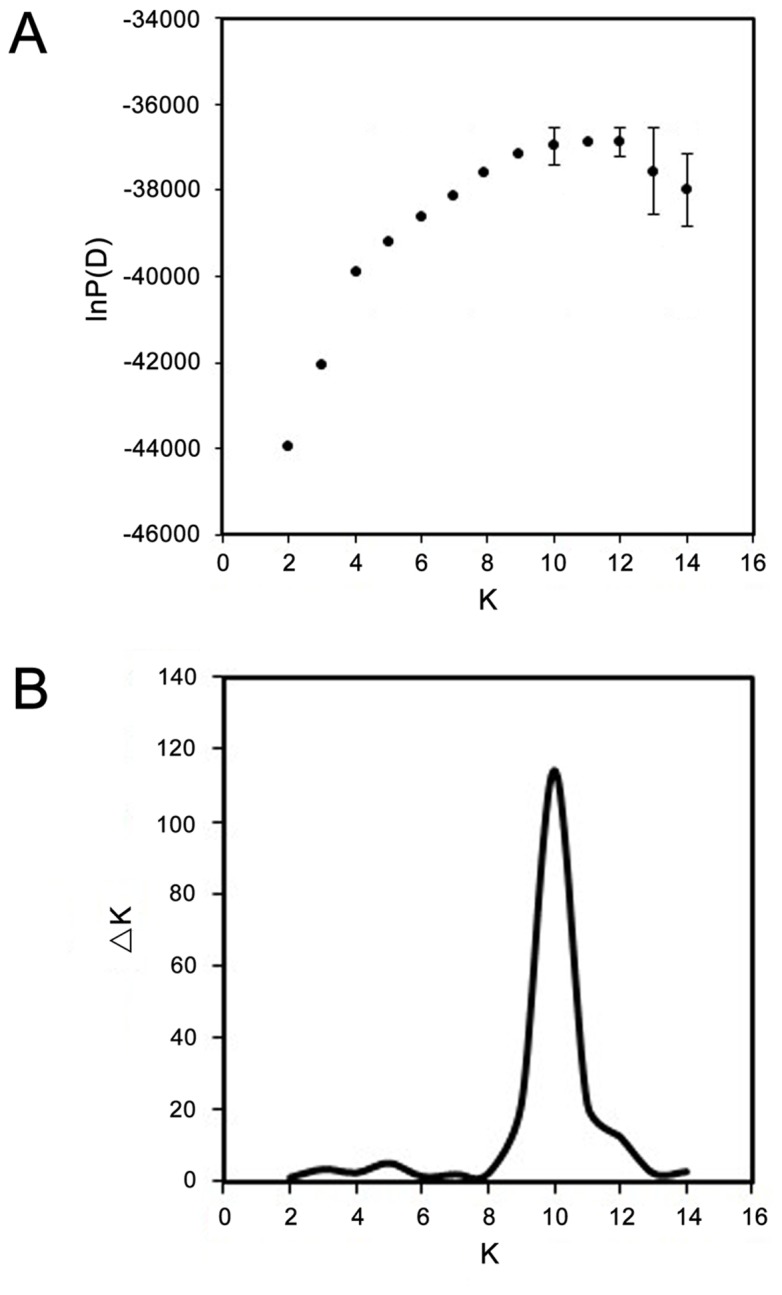
Figure 3. Estimation for the best subpopulation numbers based on the appropriate K values.

(A) lnP(D) values revealed using STRUCTURE 2.3.4 by 20 separate runs with K values between 2 to 14. The separate 20 runs of the software revealed 10, 11 or 12 subpopulations, which showed a stable increase with small variations. (B) The mean ΔK values of 20 separate runs with K values between 2 to 14 based on lnP(D) values. The mean values of ΔK among the 20 runs reached a maximum at K = 10.
