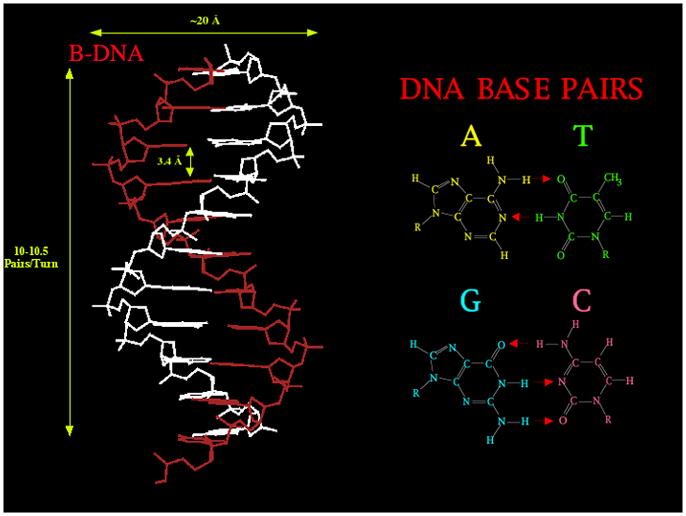
Figure 1. B-DNA.

The molecular structure and dimensions of key freatures of the molecule is shown on the left. The base pairs are shown on the right, where red arrows represent hydrogen bonded interactions.

The molecular structure and dimensions of key freatures of the molecule is shown on the left. The base pairs are shown on the right, where red arrows represent hydrogen bonded interactions.