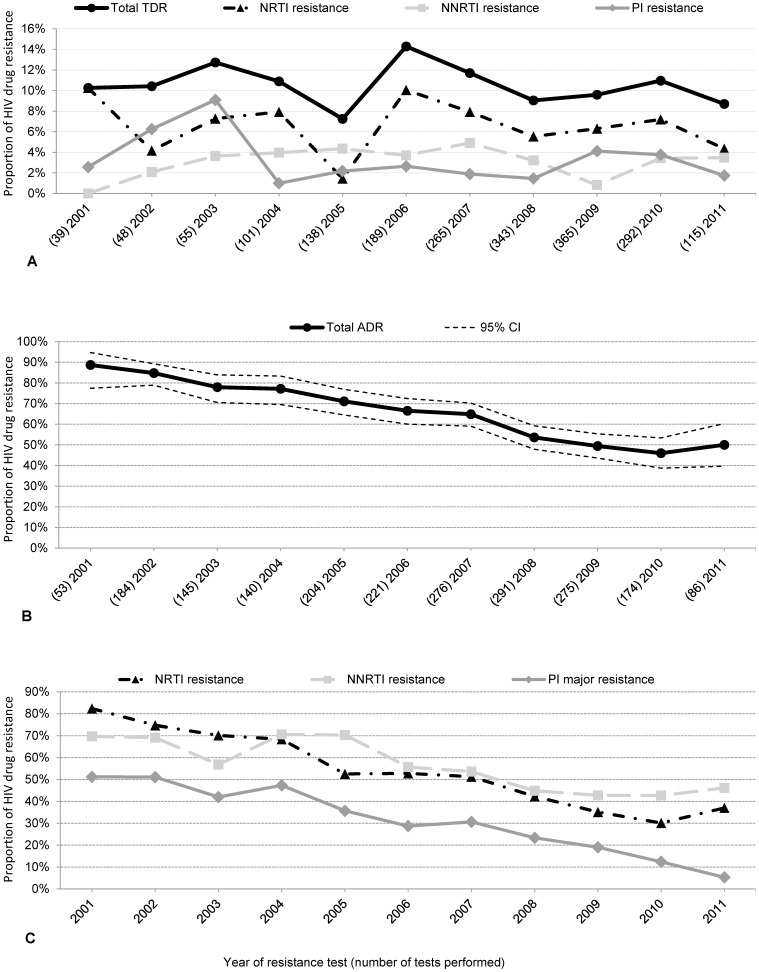
Figure 1. Proportion of HIV drug resistance in sequences from treatment naïve patients and treatment experienced patients between 2001 and 2011.
A Proportion of HIV drug resistance was determined using the first Prot/RT sequences from treatment naïve patients (n = 1950) by year according to the SDRM mutation list (Bennett et al. 2009). The proportion of TDR over time was stable at 10.4% (95% CI 9.1–11.8; p for trend = 0.6; 2001–2011). B Proportion of overall ADR (64%; 1,310/2,049 sequences; 95% CI 62–66) declined significantly over time (OR 0.8; 95% CI 0.77–0.83; p for trend<0.001; 2001–2011) in sequences from treated patients (n = 2,049) according to IAS mutation list 2011. C Proportion of ADR within different antiretroviral drug classes declined for all classes (NNRTI 55%, NRTI 51%, PI 30%; p for trend<0.001; 2001–2011) in sequences from patients treated with the respective drug class according to IAS mutation list 2011.

