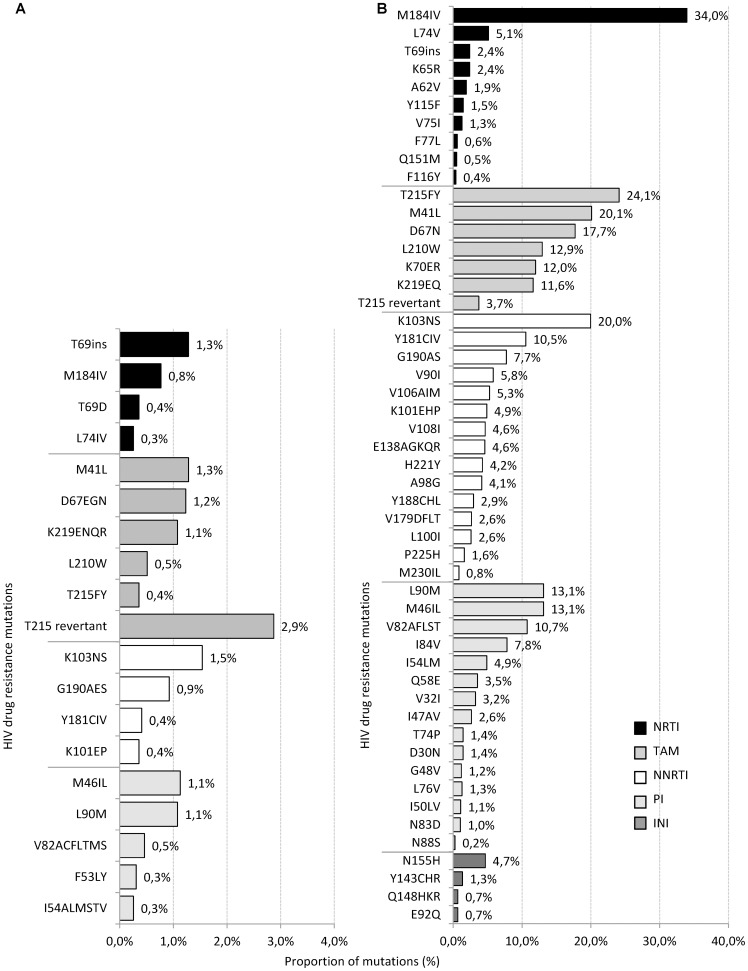
Figure 2. Proportion of resistance mutations in sequences from treatment naïve and treatment experienced patients identified between 2001 and 2011.
A Proportion of resistance mutations in first Prot/RT sequence from treatment naïve patients (n = 1950; mutations with ≥0.3% shown) according to SDRM mutation list (Bennett 2009 et al.). B Proportion of resistance mutations in sequences from treated patients (Prot/RT n = 2,049; Int n = 150) according to IAS mutation list 2011. Bars in black: NRTI mutations, grey bars: TAMS, white bars: NNRTI mutations, bars in light grey: PI mutations, dark grey bars: INI mutations.

