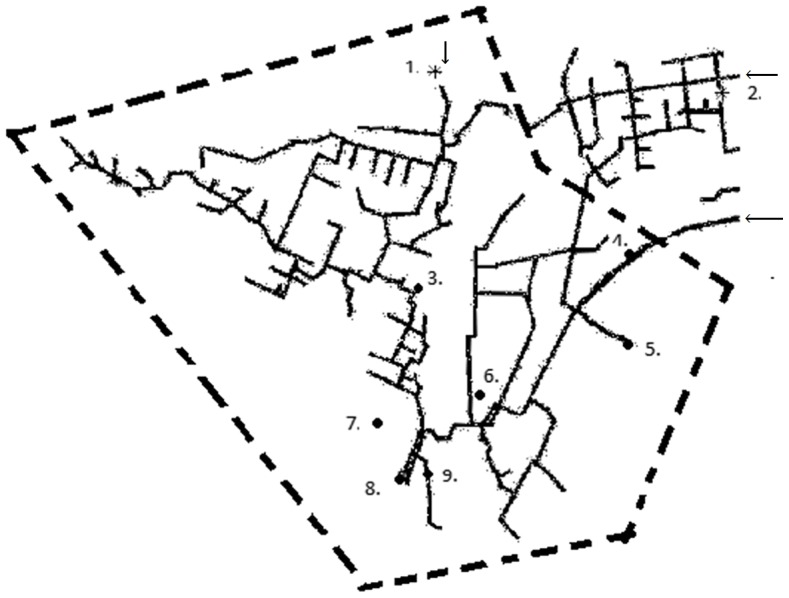
Figure 1. Schematic map of the water pipe of a defined outbreak area in Vuorela, July 2012.

The outbreak (boil water notice) area is indicated by dashed line (- - -), the water sampling points (1–9) are coded as (•) with a positive culture finding and (*) with a negative finding. Arrows indicate the inflow points of the water from the water plant (outside the figure). Points 1,2,3,6,7 and 9 are tap water sampling locations, point 4 is the water pipe line breakage point (surface water), point 5 represent drinking water from the upper water storage reservoir and point 8 is the municipal effluent sampling location.
