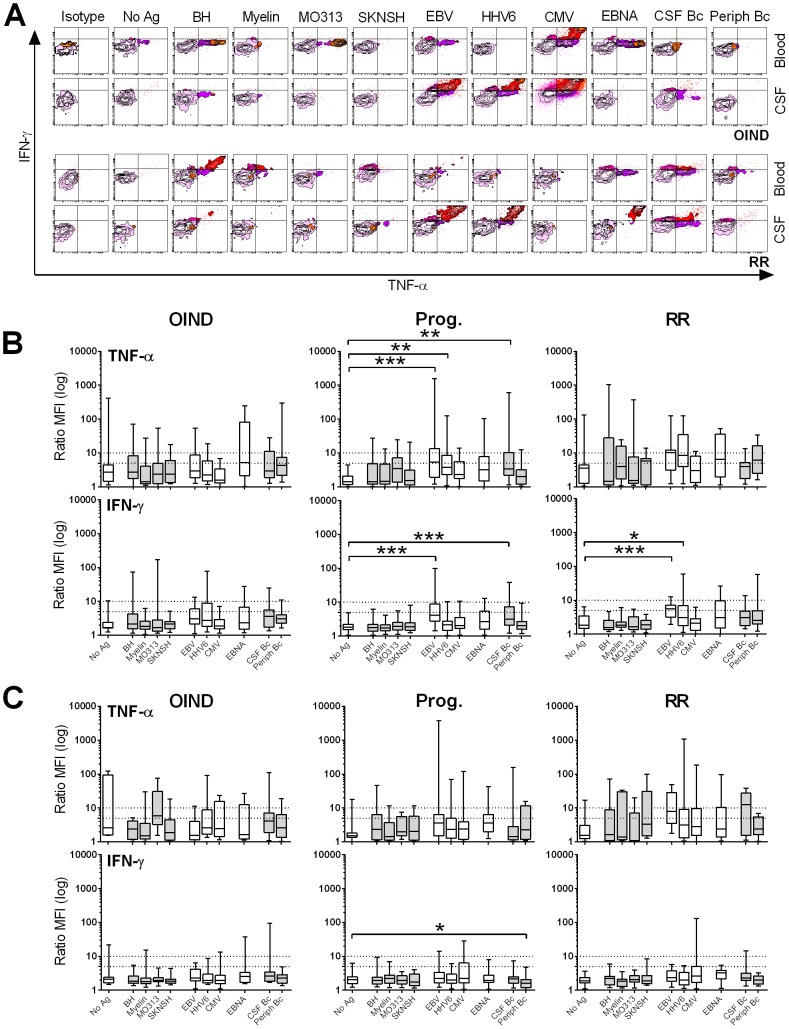
Figure 5. Differential phenotypes of peripheral and intrathecal CD4+ T cells in response to foreign Ag's.
(A) FACS plots illustrate intracellular TNF-α and IFN-γ secretion by peripheral (Blood) and intrathecal (CSF) CD4+ T cells in response to all candidate Ag's. Gating is based on the isotype controls (far left plots). Upper panels correspond to one representative OIND patient; lower panels correspond to one representative un-treated RRMS patient. MFI ratios of intrathecal to peripheral CD4+ (B) and CD8+ T cells (C) were calculated for TNF-α (upper panel) and IFN-γ (lower panel), and are shown for OIND, progressive and RRMS patients. MFI ratios are depicted as log-transformed data. *0.01<p<0.05, **0.001<p<0.01, ***p<0.001.

