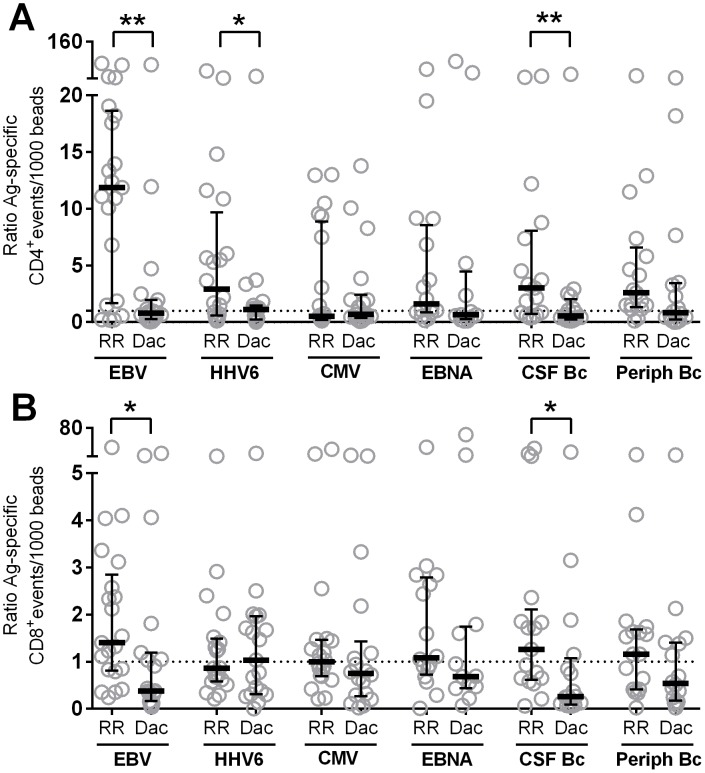
Figure 6. Daclizumab-induced normalization of Ag-specific T cell responses.
Intracellular cytokine secretion of each research subject was analyzed for IFN-γ+, TNF-α+ and double positive T cell events. The sums of all cytokine positive events were normalized to beads. Ratios of intrathecal to peripheral T cell reactivities of un-treated (RR) and DAC HYP-treated RRMS patients (Dac) were calculated to foreign Ag's for CD4+ (A) and CD8+ T cells (B). Ratios greater than one (dotted line) indicate enrichment of Ag-specific T cell events in the intrathecal compartment; ratios lower than one represent less pronounced intrathecal T cell responses. Horizontal bars represent median values; vertical lines represent interquartile ranges. *0.01<p<0.05, **0.001<p<0.01, ***p<0.001.

