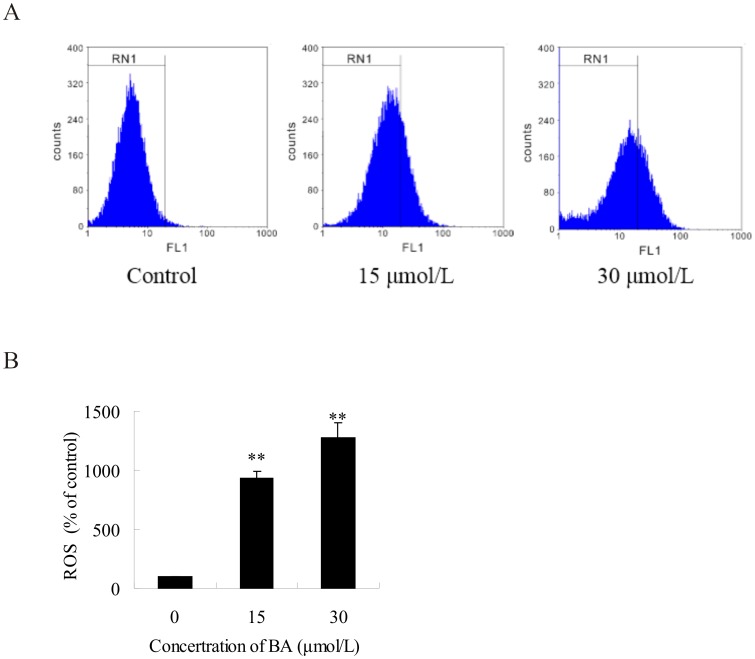
Figure 5. Flow cytometric analysis of reactive oxygen species (ROS) in BA-treated cells.
HeLa cells were treated with 15 µmol/L, 30 µmol/L BA for 48 h and then incubated with 10 mmol/L DCFH-DA for 40 min. The fluorescent intensity of DCFH was measured by flow cytometry. (A) Actual spectra from a representative single experiment. (B) The fluorescence intensity of stained cells was determined by flow cytometry. Columns show mean values of three experiments (±SD). **p<0.01 compared with the control group (0 µmol/L BA).

