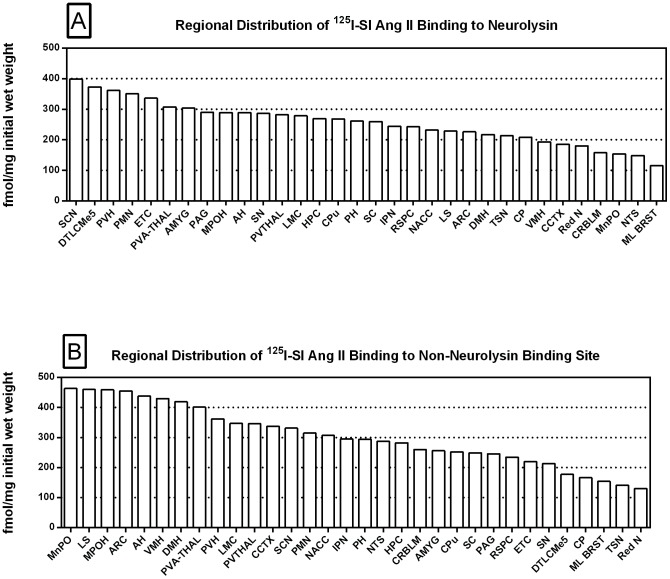
Figure 14. Regional distribution: neurolysin and non-AT1, non-AT2, non-neurolysin binding.
Regional distribution of 125I-SI Ang II binding to neurolysin (Panel A) and non-AT1, non-AT2, non-neurolysin (Panel B) in the mouse brain. Values represent the difference between non-AT1, non-AT2 Ang II binding in the WT and neurolysin KO mouse brains in 32 regions. AH, Anterior Hypothalamus; AMYG, Amygdala; ARC, Arcuate Nucleus; CCTX, Cingulate Cortex; CP, Choroid Plexus; CPu, Caudate Putamen; CRBLM, Cerebellum; DMH, Dorsomedial Hypothalamus; DTLCMe5, Dorsal Tegmentum, Locus Coeruleus, Mesencephalic Nucleus of the Trigeminal Nerve; ETC, Entorhinal Cortex; HPC, Hippocampus; IPN, Interpeduncular Nucleus; LMC, Limbic Cortex; LS, Lateral Septum; ML BRST, Mediolateral Brain Stem; MnPO, Median Preoptic Nucleus; MPOH, Medial Preoptic Nucleus; NACC, Nucleus Accumbens; NTS, Nucleus Tractus Solitarius; PAG, Periaqueductal Gray; PH, Posterior Hypothalamic Area; PMN, Premamillary Nucleus; PVA-THAL, Paraventricular Thalamic Nucleus, Anterior; PVH, Paraventricular Hypothalamic Nucleus; PVTHAL, Paraventricular Thalamic Nucleus; Red N, Red Nucleus; RSPC, Retrosplenial Cortex; SC, Superior Colliculus; SCN, Suprachiasmatic Nucleus; SN, Substantia Nigra; TSN, Triangular Septal Nucleus; VMH, Ventromedial Hypothalamic Nucleus.

