
Figure 15. AT1 and AT2 receptor binding comparison.
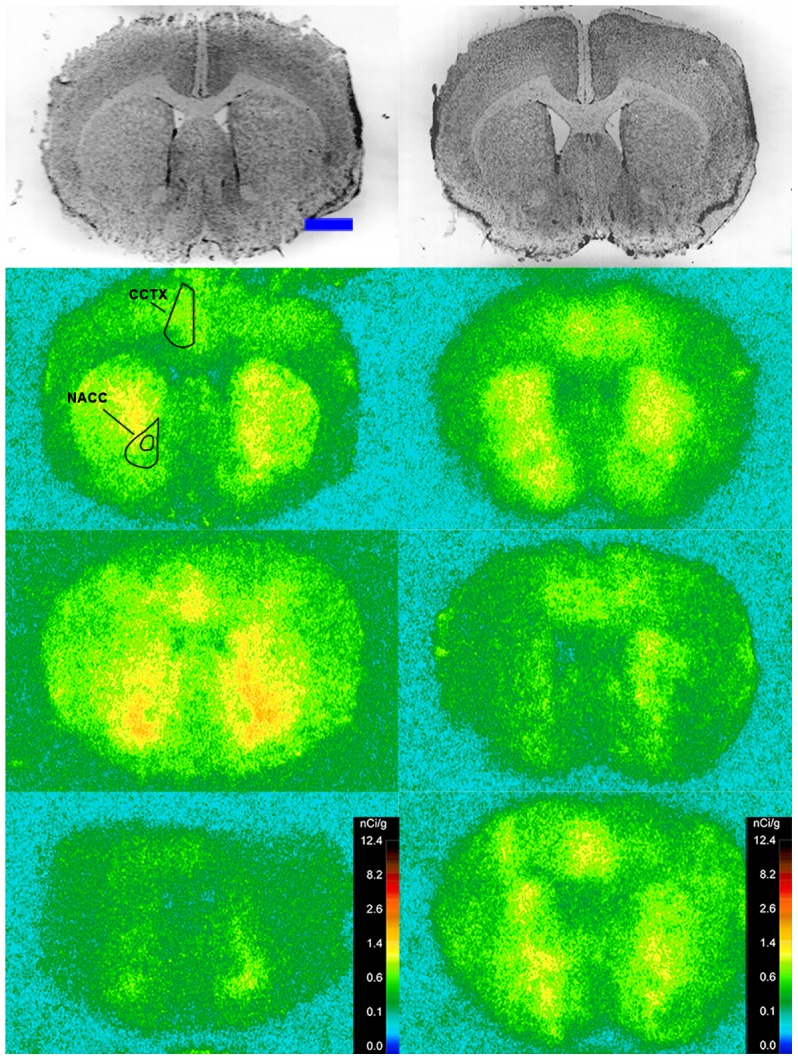
Comparison of 125I-SI Ang II binding to the AT1 and AT2 receptors of neurolysin KO (right panels) and WT (left panels) mouse strain brains in the presence of PD123319 or losartan, respectively. Approximate coordinates relative to Bregma: +0.98 mm (histology and autoradiograms) for KO, and Bregma +0.92 (histology), +0.86 (AT1), and +0.98 mm (AT2 and non-specific) for WT. Top row of panels are thionin-stained coronal sections adjacent to the sections used to generate the autoradiograms for “total” 125I-SI Ang II binding to the AT1 receptor (second row), AT2 receptor (third row), and “non-specific” 125I-SI Ang II binding (fourth row), represented in pseudocolor. The vertical calibration bar represents the relationship between binding density of 125I-SI Ang II and the color spectrum. The horizontal calibration bar in the upper left panel = 2 mm. This pattern is repeated for Figures 16 and 17.