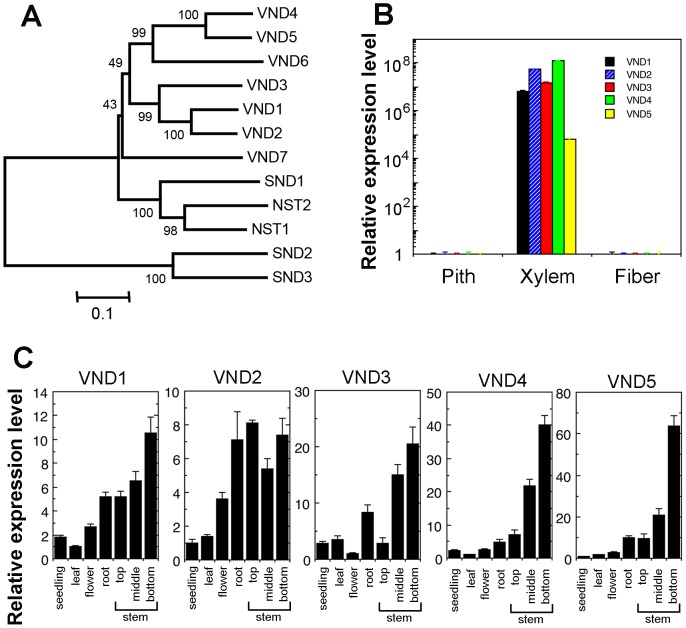
Figure 1. Phylogenetic and gene expression analyses of VNDs.
(A) Phylogenetic relationship of VND1 to VND5 together with other Arabidopsis secondary wall NACs. The phylogenetic tree was constructed with the neighbor-joining algorithm using the neighbor-joining method in MEGA5.2 (Tamura et al., 2011). Bootstrap values resulted from 1,000 replicates are shown at the nodes. (B) Quantitative PCR analysis showing the expression of VND1 to VND5 in different cell types isolated from Arabidopsis inflorescence stems. The expression of each VND in pith cells was set to 1. (C) Quantitative PCR analysis showing the expression of VND1 to VND5 in different organs. The expression of each VND in the organ with the lowest expression was set to 1. Error bars denote SE of three biological replicates.

