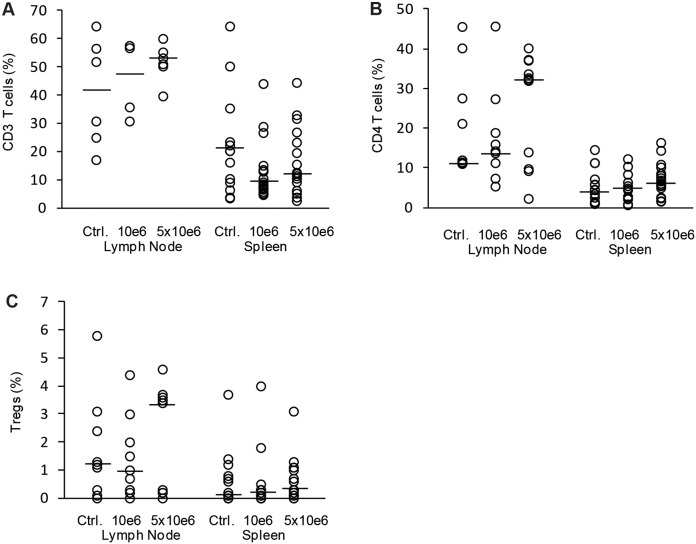
Figure 6. Assessment of T-cell populations after modified ECP therapy.
T-cell subpopulations in GvHD mice treated by modified ECP were analyzed. ECP cells were isolated from wild type C57BL/6 spleens and treated with 8-Methoxypsoralen and UV-A light. Subsequently splenocytes were injected in GvHD mice after allogeneic B6→BALB/c bone marrow transplantation. ECP was performed 4 times at weekly intervals with cell concentrations of either 1×10⁶ cells or 5×10⁶ cells. Control animals were treated with PBS in parallel (Ctrl.). Percentage of CD3 positive T-cells (A), of CD4 positive T-helper cells (B) and CD4 CD25 FoxP3 positive Tregs (C) from all lymph node cells or splenocytes. Analysis is based on 9 animals treated with 1×10⁶ cells (10e6), 11 animals treated with 5×10⁶ cells (5×10e6) and 9 control mice (Ctrl.). Animals were sacrificed when reaching clinical GVHD score ≥6 or at day 56 after BMT (dot-plot with median).

