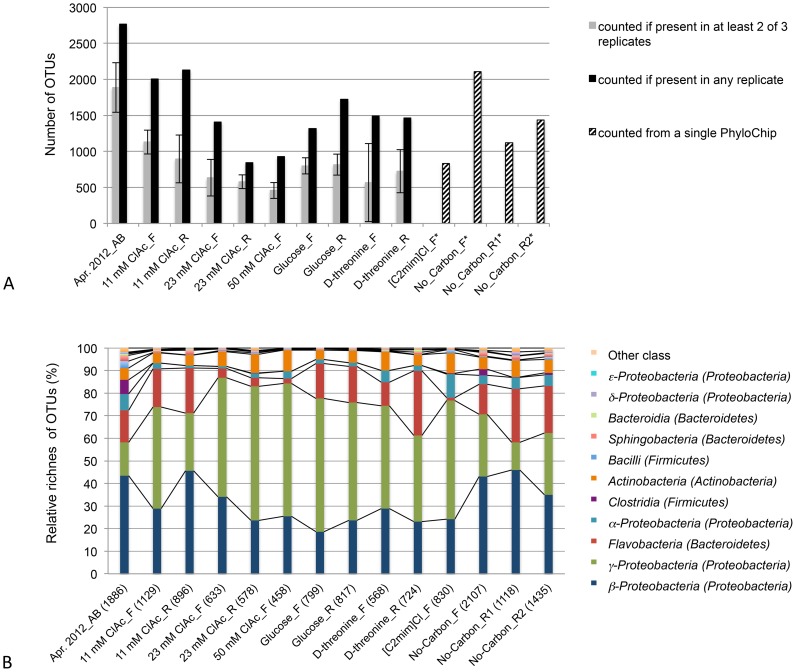
Figure 3. Number of OTUs and the class composition of the April, 2012 aeration-basin and laboratory-cultured samples.
(A) Numbers of OTUs counted present in the preserved and maintained aeration-basin samples and the laboratory-cultured samples, as a function of the counting method. (B) Relative OTU richness at the class level. Relative OTU richness was calculated by dividing the number of OTUs (counted if present in at least two of three replicates) for a given class by the total number of OTUs in a given sample (shown in parentheses). _AB indicates aeration basin sample, _F indicates flask cultures, and _R indicates reactor cultures. An OTU was counted present if it was detected in at least two of three sample replicates, except for the [C2mim]Cl and No-Carbon flask-culture samples (three replicates were pooled together) and for the No_Carbon_R1 and No_Carbon_R2 (data from a single PhyloChip) (see Methods and Results).

