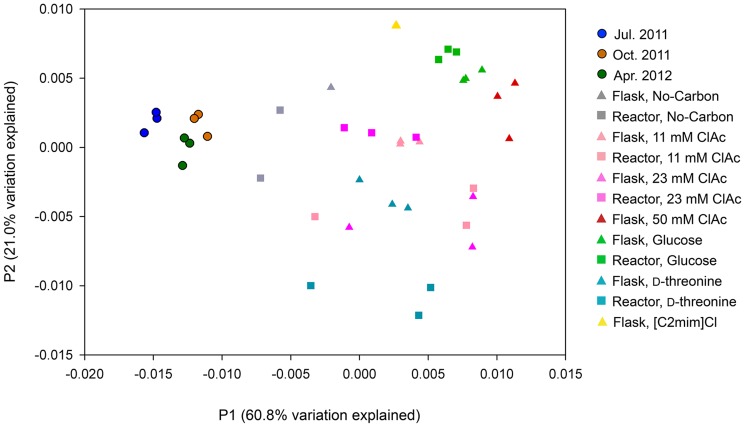
Figure 4. Principal Coordinate Analysis (PCoA) of the aeration-basin and the laboratory-cultured sample bacterial communities.
Samples are projected onto the first (P1) and second (P2) principal coordinate axes. Three sample replicates are plotted for each community, except for the [C2mim]Cl and No-Carbon flask laboratory-culture samples, for which the three replicates were pooled together (see Methods and Results).

