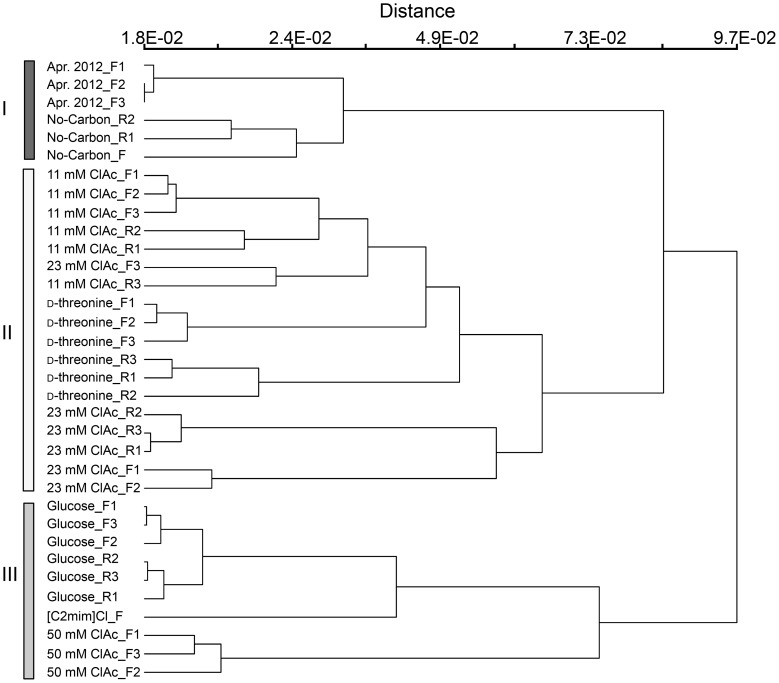
Figure 5. Hierarchical clustering of the aeration-basin and the laboratory-cultured samples.
The clustering was constructed with the relative OTU abundance data employing the Bray-Curtis distance measurement and group average linkage methods. _F indicates flask cultures and _R indicates reactor cultures.

