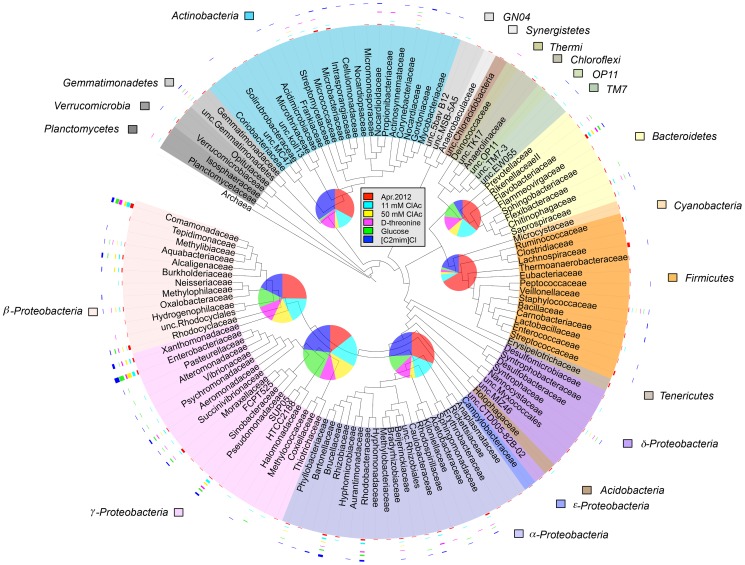
Figure 6. Microbial composition of the April 25, 2012 aeration-basin and flask-cultured samples.
FastTree was used to generate an approximate-maximum-likelihood phylogenetic tree, which was rooted with archaea. The leaves of the tree list taxa at the family level, or for unclassified (unc.) families the lowest ancestor. Families belonging to the same phylum (or, class level for the phylum Proteobacteria) are shaded in the same color. Band intensity graphs outside each leaf (family) indicate the number of species in the family detected in each sample. Pie charts at the nodes of major phyla (or, classes) show the number of species in each sample. Pie chart area correlates with the total number of the species of the given phylum, or class. The pie and band intensity graphs do not share the same scale (the minimum number of species in each band intensity graph is 1, and the maximum is 15; in each pie chart, the minimum number of species is 1, and the maximum is 38). An OTU was counted present if it was detected in at least two of three sample replicates, except for the [C2mim]Cl samples, for which the three replicates were pooled together (see Methods and Results).

