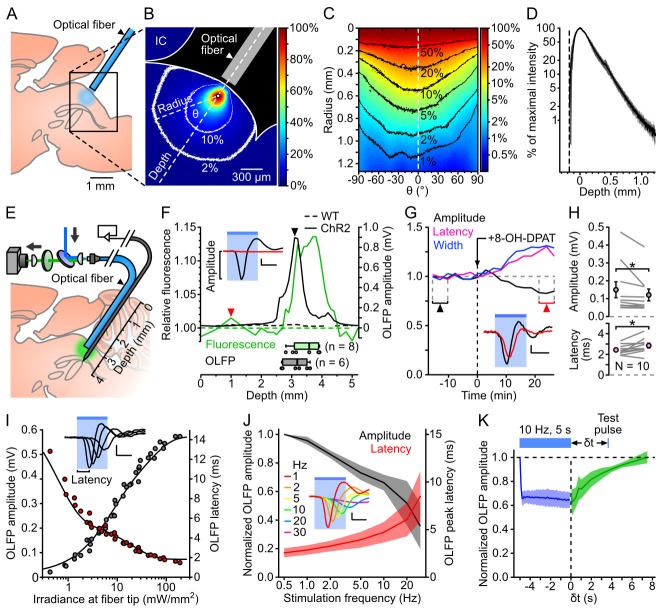
Figure 2. Photostimulation of DRN 5-HT neurons in vivo.
A, Schematics of the experiment used to assess the spread of blue light in the DRN. B, Example image of DRN illumination. The intensity is color-coded relative to the pixel of maximal intensity (white dot). The 10 and 2% contour lines are shown in white. IC: inferior colliculus. C, Circular profile plot calculated from B, showing pixel intensities along concentric lines centered on the brightest pixel. D, Average intensity profile (± SD, shaded area; n = 3 brains) along the fiber axis. The depth and intensities are calculated relative to the brightest pixel. E, Schematics of the setup used to map YFP fluorescence and photoevoked firing in vivo. F, Example of a combined electrophysiological and fluorescence mapping experiment in a ChR2-YFP-expressing SERT-Cre (ChR2, solid lines) and a wild-type (WT, dotted lines) mouse. Top: normalized fluorescence (green, left axis) and OLFP amplitude (black, right axis) profiles plotted against the optrode position. Bottom: boxplots showing the optrode position at the point of maximal fluorescence (green, n = 8 mice) and largest OLFP amplitude (grey, n = 6 mice). Inset: average OLFP for the ChR2 mouse at the locations marked by the arrowheads. G, Example showing the time course of the effect of the 5-HT1A receptor agonist 8-OH-DPAT on the OLFP amplitude (black), latency (purple) and width (blue). Bin: 158 s. Inset: average OLFP before (black) and after (red) 8-OH-DPAT injection (taken from the periods indicated by arrowheads). H, Top: OLFP amplitude before and after 8-OH-DPAT injection (mean ± SD: 150±121 µV and 121±105 µV respectively, n = 10). Bottom: OLFP peak latency before and after 8-OH-DPAT injection (mean ± SD: 2.4±0.5 ms and 2.8±0.7 ms, n = 10). Changes are significant in both cases (P = 0.037 and P = 0.030 respectively, paired Wilcoxon rank sum test). Error bars represent the SEM. I, Example illustrating the dependence of the OLFP amplitude (grey points) and latency (red points) on the irradiance at the fiber tip. The sum of two exponential functions was fitted to each curve (black lines). Inset: superimposed OLFPs for 0.2, 0.7, 1.6 and 6.0 mW·mm−2. J, Normalized average (± SD, shaded area) OLFP amplitude (black, left axis) and latency (red, right axis) versus photostimulation frequency (n = 7 mice). K, Average OLFP amplitude recovery curve (green; ± SD, shaded area) assessed by delivering test pulses at variable intervals (δt) after 10 Hz, 5 s trains of 6 ms light pulses (n = 4 mice). Blue: average amplitude during the trains.

