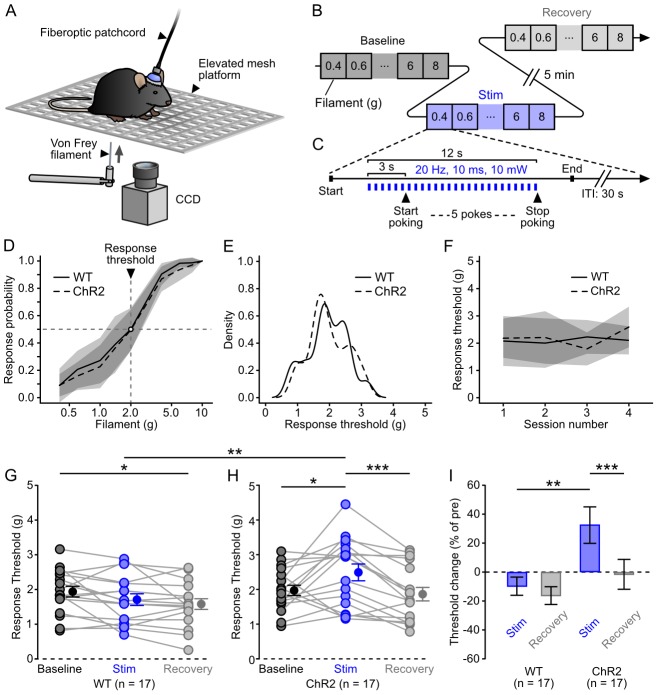
Figure 3. Decreased responsivity to mechanical stimuli during DRN 5-HT neurons photostimulation.
A, Schematics of the experiment. B, Structure of a session. C, Structure of a trial in the “stim” block. The filament was applied to the hindpaw during a 12 s train of light pulses. D, Average baseline response probability curves for control (infected WTs, solid line, n = 17) and ChR2 (dashed line, n = 17) mice. E, Kernel density estimates of the baseline threshold distribution for control (WT, solid line) and ChR2 (dashed line) mice. F, Average baseline threshold across sessions for control (WT, solid line) and ChR2 (dashed line) mice. G–H, Thresholds for all control and ChR2 mice in the baseline (dark grey), “stim” (blue) and recovery (light grey) blocks. *: P<0.05 (paired Wilcoxon rank sum test); ***: P<0.001 and **: P<0.01 (unpaired Wilcoxon rank sum test). (I) Threshold change for control and ChR2 mice in the “stim” (blue) and recovery (light grey) blocks. ** P<0.01 and *** P<0.001 (paired and unpaired Wilcoxon rank sum test respectively). Shaded areas and error bars represent the SD in all panels.

