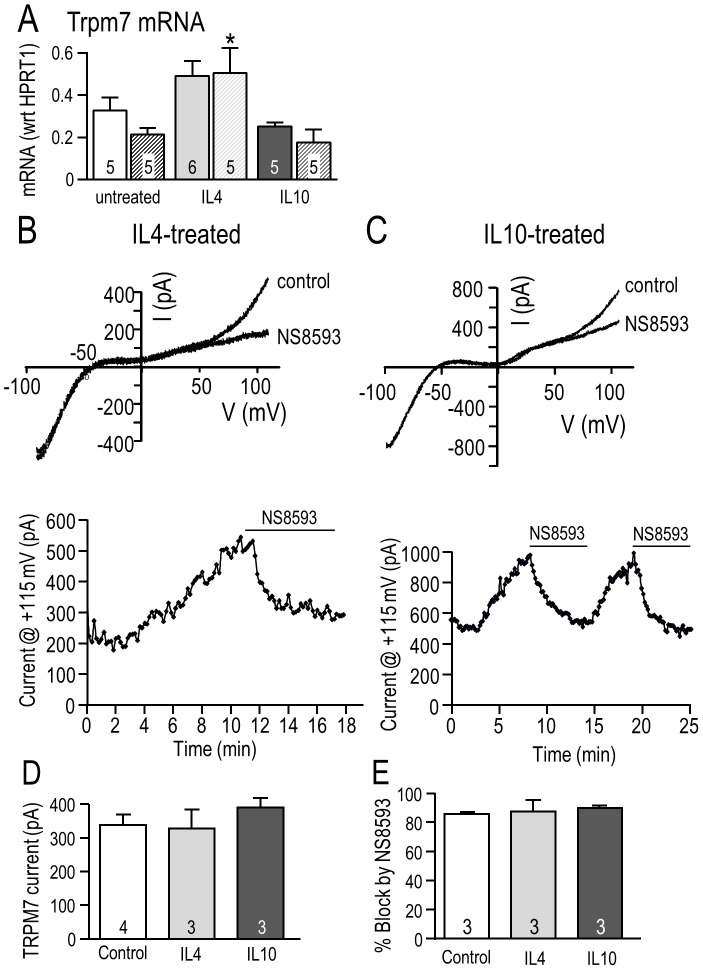
Figure 8. Effects of IL4- and IL10-treatment on TRPM7 expression, current and block by NS8593 in primary rat microglia.
A. TRPM7 mRNA expression was measured using quantitative real-time RT-PCR at 6 hr (solid bars) and 24 hr (striped bars) in unstimulated rat microglia or after treatment with 20 ng/ml IL4 or 20 ng/ml IL10. Values are expressed as mean expression (normalized to HPRT1) ± SEM, with the number of individual cultures indicated on each bar. *p<0.05 indicates the difference from time-matched control (unstimulated) cells, and was determined using a 2-way ANOVA followed by Bonferroni post-hoc test. B–E. The TRPM7 current and block by NS8593 were not affected by 24 hr treatment with 20 ng/ml IL4 or IL10. Whole-cell recordings were performed on primary rat microglia using Mg2+-free pipette solution. B, C. Representative currents (upper panels) in response to 120 ms-long ramps from −100 to +115 mV, from a holding potential of −10 mV. Time course of the current (lower panels) measured at +115 mV. D, E. Summary of TRPM7 current amplitudes measured at +115 mV (D) and percent inhibition of TRPM7 currents by 7 µM NS8593 (E). Graphical data are presented as mean ± SEM for the number of cells indicated on each bar, and were compared using a one-way ANOVA with Tukey's post-hoc test.

