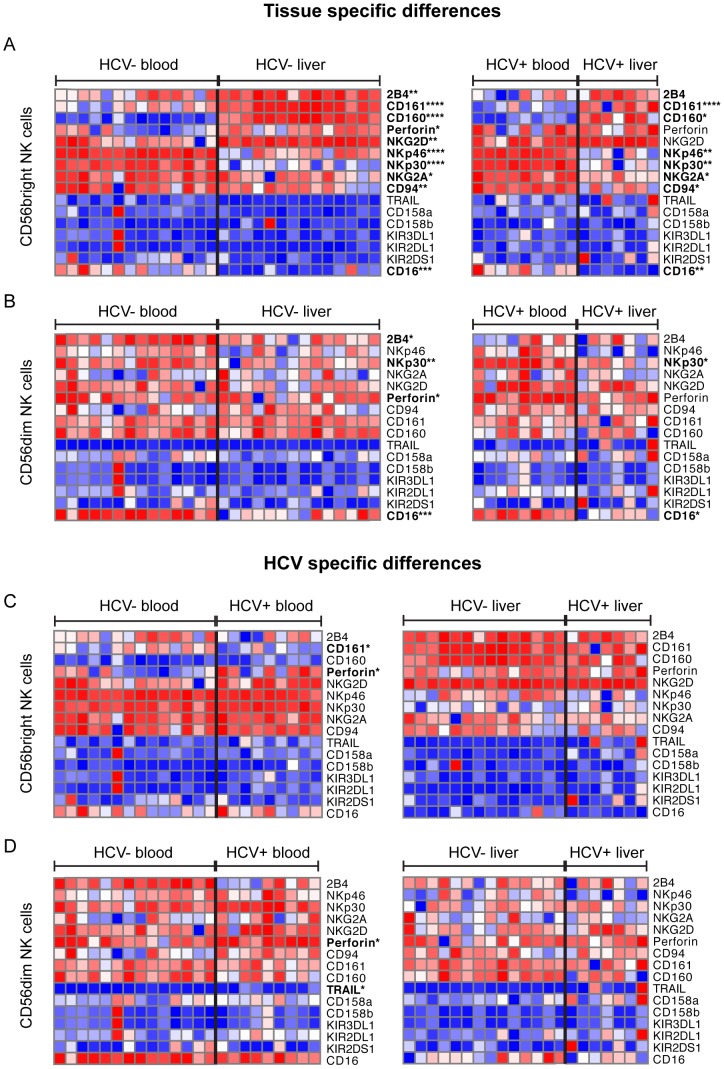
Figure 2. Immunophenotypic profiles of blood and liver-resident NK cell subsets.
Immunophenotyping of liver and blood NK cell subsets in groups of HCV-infected and –uninfected individuals was performed by flow cytometry, and both tissue-specific differences (A) and disease-specific differences (B) were analyzed. Data is presented as a heatmap, with values displayed as relative within each row. Statistical significance was accepted at p<0.05 and is indicated by * (p<0.05), ** (p<0.01), *** (p<0.001) and **** (p<0.0001).

