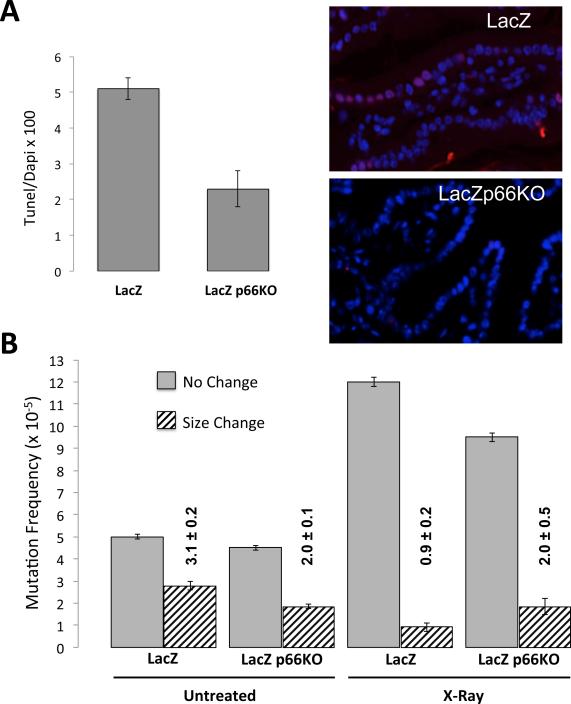
Figure 3. Frequency of mutations in small intestine of lacZ and lacZp66KO mice following X-ray radiation.
(A) Percentage of TUNEL positive cells (n= 3-4 mice; p-value<0.05 for differences among the two groups) and representative image of TUNEL assay in small intestine sections from lacZ and lacZp66KO mice. (B) Frequencies of no-change (open bars) and size-change (hatched bars) mutations in small intestine of lacZ and lacZp66KO mice exposed to X-rays.

