
Figure 8.
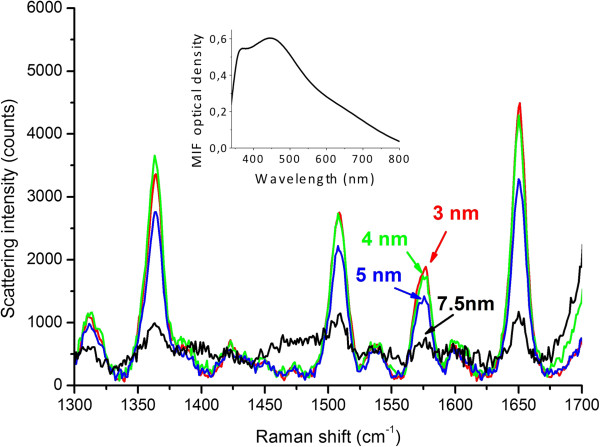
SERS spectra of rhodamine 6G. Measured using the TiO2-covered sample prepared using annealing in hydrogen at 300°C for different spacer thicknesses. Measurement power 50 μW, exposure time 20 s, and approximate spot size 5 μm. Inset: absorption spectrum of the initial MIF.