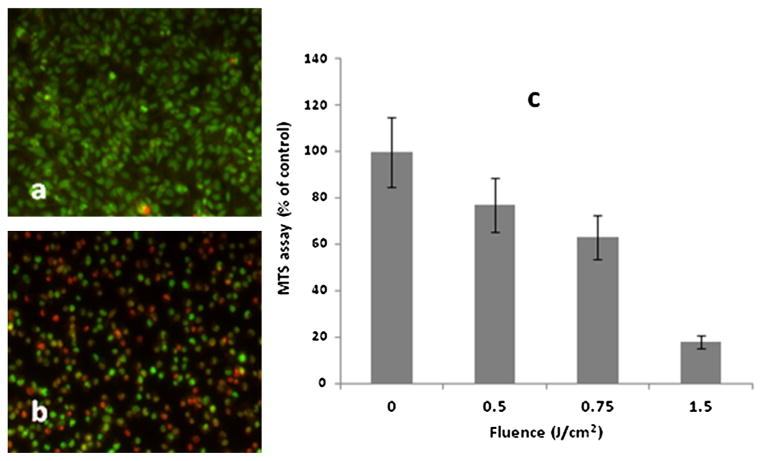
Fig. 2.

Live dead assay of U251 cell monolayers following AlPcS2a PDT at 0J (a) and 0.75 J/cm2 (b). The cells were stained using a combination of Hoechst 33342 and Ethidium Homodimer 1 and were visualized using an inverted Zeiss laser-scanning microscope Simultaneously detected blue and red emissions were isolated by using BP 390–465 IR and BP 565–615 IR band pass filters, respectively. Fluorescent images were pseudo-colored blue and red. Live: blue cells, dead: red cells. c: AlPcS2a-mediated PDT at increasing fluence levels. MTS assay 24 hours following light treatment. The results are shown as a percentage of dark controls ± SE (dark control = 100%) (c). [Color figure can be seen in the online version of this article, available at http://wileyonlinelibrary.com/journal/lsm]
