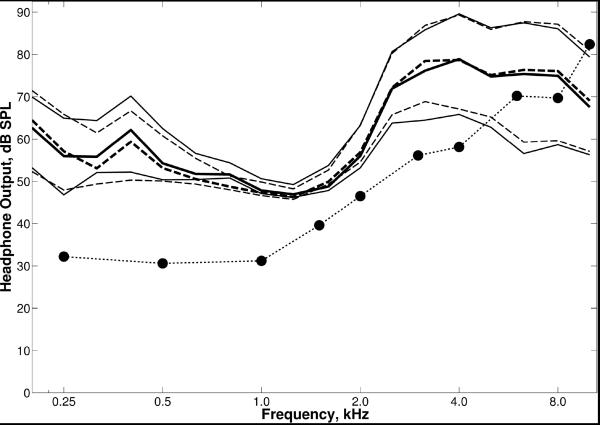
Figure 3.
Average pure tone thresholds of the HI listeners measured using the Sennheiser headphones (filled circles) are plotted alongside the distribution of 1/3-octave band levels for amplified speech energy in the wideband conditions. The solid and dashed lines represent conditions generated using recordings from the Inteo and Naída hearing aids, respectively. The thick line in the center of each distribution corresponds to the amplified long-term average speech spectrum of the VCs and the top and bottom thin lines correspond to the peaks (1st percentile) and the valleys (70th percentile), respectively.

