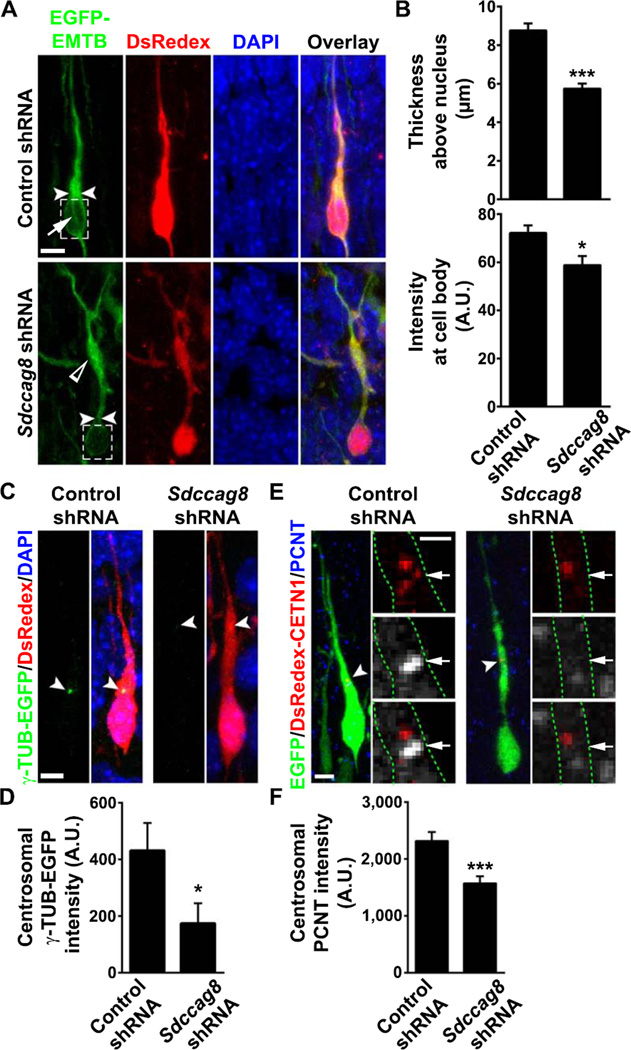
Figure 5. Depletion of SDCCAG8 impairs PCM accumulation and MT organization between the centrosome and the nucleus.
(A) Representative images of bipolar neurons expressing EGFP-EMTB (green) that labels MTs and DsRedex/Control or Sdccag8 shRNA (red) stained for DAPI (blue). Arrowheads indicate the thickness of EGFP-EMTB-labeled MTs above the nucleus and broken lines highlight MTs around the nucleus. The arrow indicates MTs that form the perinuclear cage. The open arrowhead indicates the accumulation of MTs in the dilated region of the leading process some distance away from the nucleus in cells expressing Sdccag8 shRNA. Scale bar: 10 µm (B) Quantification of the thickness of the EGFP-EMTB-labeled MTs above the nucleus (top) and its intensity around the nucleus (bottom). Data are presented as mean ± s.e.m. (Control, n = 24; Sdccag8, n = 28). A.U., arbitrary unit. *, p<0.05; ***, p<0.001. (C) Representative images of bipolar neurons expressing γ-TUB-EGFP (green) and DsRedex/Control or Sdccag8 shRNA stained with DAPI (blue). Arrowheads indicate the centrosomes where γ-TUB-EGFP accumulates. Scale bar: 5 µm. (D) Quantification of the γ-TUB-EGFP focus intensity at the centrosome. Data are presented as mean ± s.e.m. (Control, n = 54; Sdccag8, n = 43). *, p<0.05 (E) Representative images of bipolar neurons expressing DsRedex-CETN1 (red) and EGFP/Control or Sdccag8 shRNA (green) stained for PCNT (blue or white). Broken lines indicate the cell boundary. Arrowheads and arrows indicate the centrosomes labeled by DsRedex-CETN1. Scale bars: 5 µm and 2 µm. (F) Quantification of the PCNT intensity at the centrosome. Data are presented as mean ± s.e.m. (Control, n = 106; Sdccag8, n = 100). ***, p<0.001.

