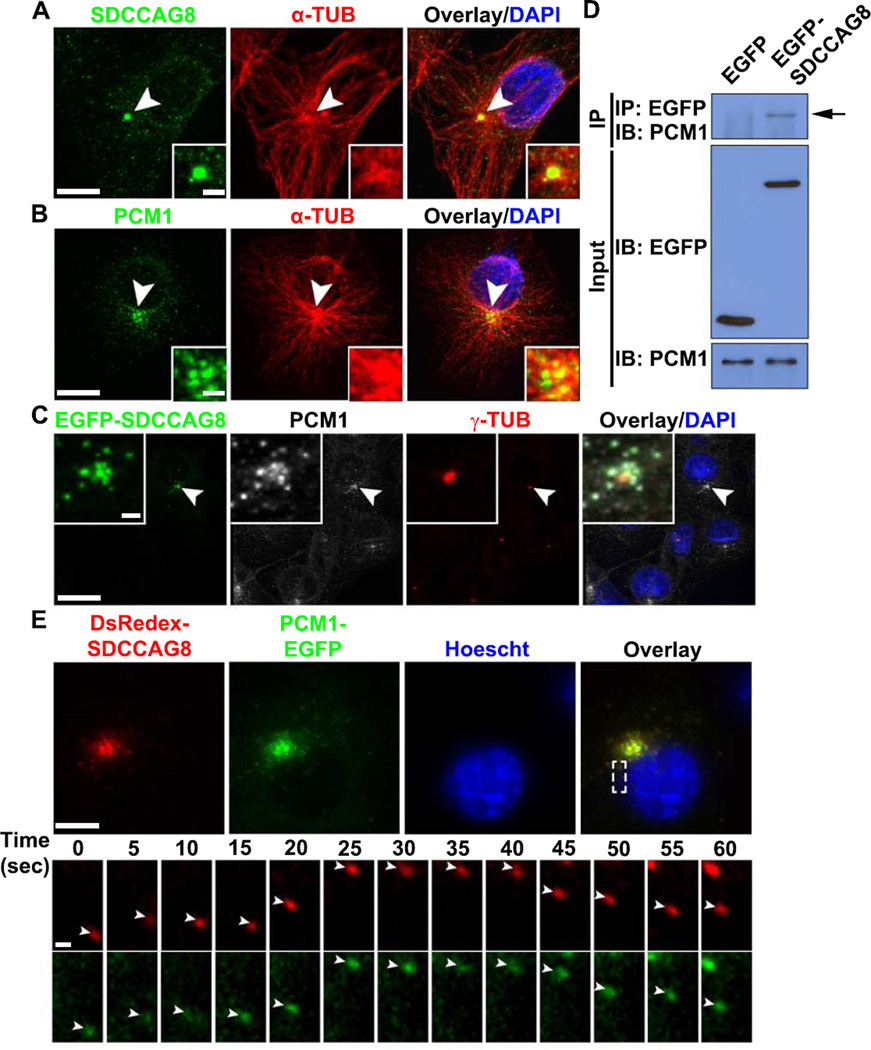
Figure 6. SDCCAG8 interacts, co-localizes and co-traffics with PCM1.
(A, B) Representative images of COS7 cells stained for SDCCAG8 (A) or PCM1 (B) (green), α-TUB (red) and with DAPI (blue). Arrowheads indicate the centrosome. High magnification images of the centrosomal region are shown in the inset. Scale bars: 10 µm and 2.5 µm. (C) Representative images of COS7 cells expressing a low level of EGFP-SDCCAG8 (green) stained for PCM1 (white), γ-TUB (red), and with DAPI (blue). Arrowheads indicate the centrosome and high magnification images of the centrosomal region are shown in the inset. Scale bars: 20 µm and 2 µm. (D) Interaction between EGFP-SDCCAG8 with PCM1 detected by co-immunoprecipitation in COS7 cells. (E) Representative images of live COS7 cells expressing DsRedex-SDCCAG8 and PCM1-EGFP stained with Hoescht (blue). High magnification kymographs of one region (broken lines) are shown at the bottom. Note that DsRedex-SDCCAG8 and PCM1-EGFP puncta (arrowheads) co-traffic. Scale bars: 10 µm and 1 µm.

