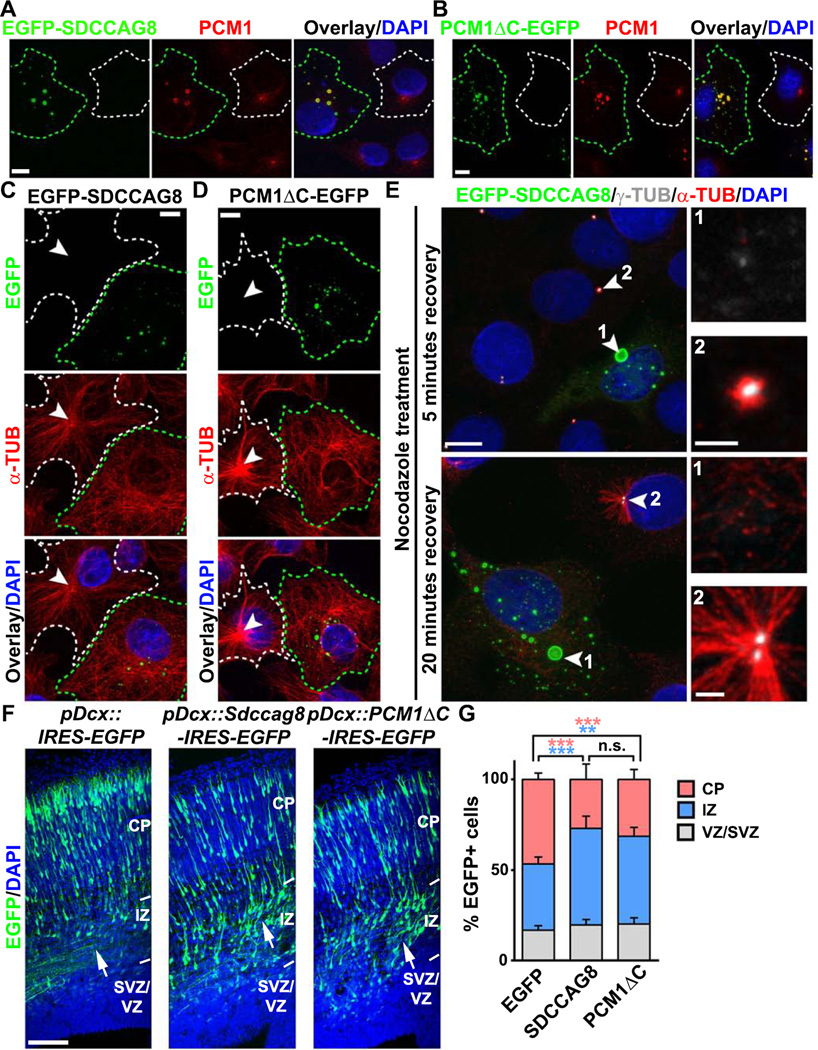
Figure 7. SDCCAG8 over-expression disrupts PCM1 accumulation, MT organization and neuronal migration.
(A, B) Representative images of COS7 cells expressing EGFP-SDCCAG8 (A) or PCM1ΔC-EGFP (B) (green) stained for endogenous PCM1 (red) and with DAPI (blue). Green broken lines indicate an EGFP-SDCCAG8- or PCM1ΔC-EGFP-expressing cell and white broken lines indicate a nearby non-transfected cell. Scale bars: 10µm. (C, D) Representative images of COS7 cells expressing EGFP-SDCCAG8 (C) or PCM1ΔC-EGFP (D) (green) stained for α-TUB (red) and with DAPI (blue). Green broken lines indicate an EGFP-SDCCAG8- or PCM1ΔC-EGFP-expressing cell and white broken lines indicate a nearby non-transfected cell. Arrowheads indicate the radial organization of MTs emanating from the centrosome. Scale bars: 10µm. (E) Representative images of COS7 cells expressing EGFP-SDCCAG8 (green, cell 1) recovering from nocodazole treatment stained for γ-TUB (white) and α-TUB (red), and with DAPI (blue). Arrowheads indicate the centrosomes. High magnification images of the centrosomal region are shown to the right. Scale bars: 10 µm, 2 µm, and 2 µm. (F) Representative images of E16.5 cortices electroporated with EGFP (left), SDCCAG8-IRES-EGFP (middle), or PCM1ΔC-IRES-EGFP (right) (green) under the control of a doublecortin (Dcx) promoter at E13.5 and stained with DAPI (blue). Arrows indicate the accumulation of cells expressing SDCCAG8 or PCM1ΔC in the IZ. IRES stands for internal ribosome entry site. Scale bar: 100 µm. (G) Quantification of the distribution of EGFP+ cells in different regions of the developing cortex. Data are presented as mean ± s.e.m. (EGFP, n = 2,407 cells; SDCCAG8, n = 1,703 cells; PCM1ΔC, n = 1,763 cells; five brains for each condition). ***, p<0.001; **, p<0.01; n.s., not significant.

