
Fig. 6.
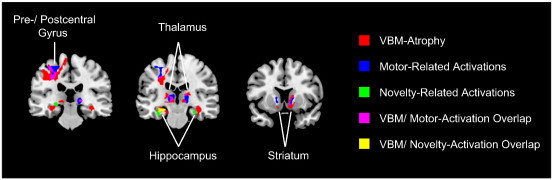
Overlap between structural and functional alterations. Results from the VBM analysis (illustrated in red) and for changes in motor- (blue) and novelty-related (green) activity were superimposed onto an anatomical template image. Direct overlap of functional motor-related (fMRI) and structural (VBM) alterations is shown in magenta, while overlap between functional novelty-related and structural alterations is illustrated in yellow.