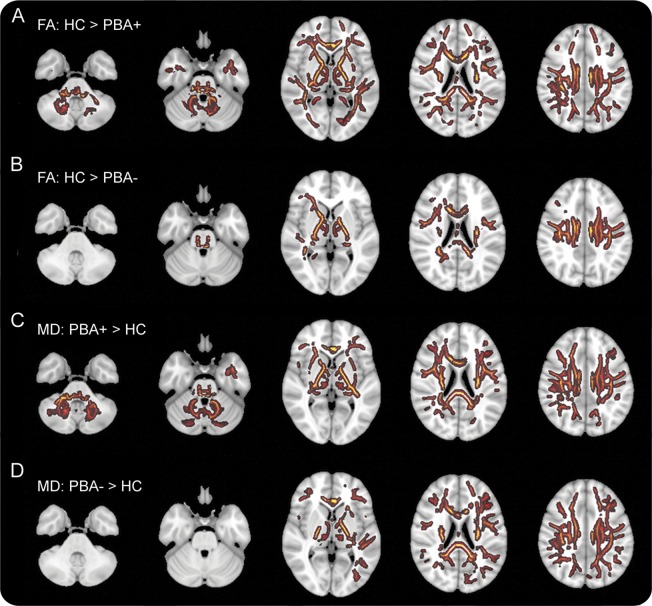
Figure 2. Differences in diffusion tensor imaging between patients and healthy controls.
Tract-based spatial statistics showing differences in diffusion properties between white matter skeletons of healthy controls (HC) and patients with pseudobulbar affect (PBA+, rows A and C) and between healthy controls and patients without pseudobulbar affect (PBA−, rows B and D) projected on axial sections. White matter areas shown in color were significantly different between patients and healthy controls (threshold-free cluster enhancement with p < 0.05, correction using family-wise error rate). (A, B) Differences in fractional anisotropy (FA) maps. (C, D) Differences in mean diffusivity (MD) maps. Axial sections are shown in radiologic convention with right brain on the left side.

